All published articles of this journal are available on ScienceDirect.

Enhancing Work Zone Safety: Evaluating Static Merge Strategies Through Microscopic Traffic Simulation
Abstract
Background
The utilization of merging control has been proposed as a strategy to maximize the capacity of roads in work zone areas. The static Early Merge (EM) and static Late Merge (LM) controls are extensively implemented among these strategies. Although many studies have investigated the efficacy of these controls through the analysis of field data or microscopic traffic simulations, such comparisons are frequently conducted under different work zone conditions, which can result in inconsistent, contradictory conclusions.
Materials and Methods
A simulation study was carried out using the VISSIM microscopic traffic simulator within a self-developed work zone featuring a 2-to-1 lane closure setup to comprehensively assess and contrast the traffic efficiency of the EM and LM controls. Furthermore, through a comprehensive analysis and comparison of network performance within the designed work zone across various scenarios, including queue length, vehicle delays, and travel time, the significant VISSIM parameters influencing the system's performance were identified.
Results
The analysis revealed that the parameters CC1 (headway time) and CC2 (longitudinal following threshold) from the car-following model exert more significant influence in the simulated work zone throughput than the Safety Distance Reduction Factor (SDRF) parameter from the lane-changing model.
Discussion
According to the simulation findings, implementing the EM control is preferable when drivers display aggressive behavior and maintain relatively short safety distances (i.e., low CC1 values). Conversely, opting for the LM control is more advisable in work zone areas where drivers demonstrate cautious driving tendencies and maintain longer safety distances (i.e., high CC1 values).
Conclusion
The efficacy of static EM and LM was analyzed in a 2-to-1 lane closure work zone on a freeway using the microscopic traffic simulator VISSIM. Simulation results were compared to identify the most relevant VISSIM parameters that influence work zone throughput. Our results indicate that the parameters CC1 and CC2 from the car-following model have a more substantial impact than the SDRF parameter from the lane-changing model. In particular, our comparison results suggest that the work zone throughput decreases in both the EM and LM scenarios as the values of CC1 and CC2 increase. Additionally, SDRF has a relatively negligible effect on the network performance of both merge strategies.
1. INTRODUCTION
A work zone refers to a section of road designated for construction or maintenance projects, often resulting in the closure of one or more lanes and reducing road capacity. Consequently, vehicles must change lanes and merge before reaching the restricted area to navigate through the work zone. During periods of heavy traffic, these maneuvers can significantly increase the risk of traffic conflicts and accidents, further limiting road capacity. This capacity reduction can result in decreased traffic flow efficiency, leading to prolonged delays and reduced throughput, as well as environmental concerns such as increased pollution and fuel consumption.
To address these significant challenges in work zones, transportation experts have proposed various control strategies to optimize road capacity utilization. Two widely employed strategies are the static Early Merge (EM) control and the static Late Merge (LM) control.
Vehicles are encouraged to merge quickly before reaching the designated merging point through static EM control. The signage placement before the merge site indicates the lane reduction. Implementing this strategy diminishes the probability of last-minute conflicts or disruptions among merging drivers, which can decrease accident rates near the merging area and guarantee uninterrupted traffic flow.
The static LM control functions differently than the early merge method. It recommends that motorists maintain their present lane for the shortest duration feasible and merge as late as possible. Like the early merge strategy, signage is strategically placed upstream to direct motorists to utilize all available lanes until they reach the designated merging location. This study aims to optimize the utilization of lane capacity, which may result in shorter queues along the roadway and a reduced probability of obstruction at exits located upstream from the construction zone.
In recent years, traffic simulation has become a viable alternative to field studies for transportation practitioners and researchers. Currently, commercial traffic simulation software is extensively employed as an essential tool in developing and strategizing transportation networks. Furthermore, due to their computational nature, simulators are not constrained by variables such as geographical location or time of observation. This enables the seamless integration of numerous control techniques into the simulation itself. By employing the same random seed and suitable configurations, this adaptability permits the replication and duplication of exact traffic conditions at any juncture throughout the simulation.
PTV Vissim is a widely adopted traffic simulator renowned for its substantial potential and versatility. Developed by the PTV Group, it features a behavior-based, time-step, and microscopic simulation model that accurately captures the dynamics of individual vehicle movements and interactions. Vissim is extensively utilized for modeling and analyzing urban and suburban traffic scenarios, showcasing its adaptability by including comprehensive simulations of public transportation and pedestrian movements. The software's emphasis on fundamental components such as car-following and lane-changing models is crucial for detailed and realistic traffic flow analysis. This adaptability and detail make PTV Vissim an ideal choice for our research, allowing us to conduct precise and comprehensive traffic simulations that align with our study's objectives.
This study presents the findings obtained by utilizing VISSIM to evaluate LM and EM controls. It involves computer simulations of static LM and EM controls within a work zone area under a two-to-one lane closure scenario. The investigation examines traffic performance indicators such as delay, total travel time, and queue length. Additionally, it's important to note that this study does not address any safety concerns.
2. LITERATURE REVIEW
2.1. Early Merge and Late Merge Simulation Studies
Several scholarly articles examined the efficacy of EM and LM control via traffic simulations. EM is a strategic approach that informs vehicles in advance of an impending lane closure in a work zone, allowing users sufficient time to identify a gap and merge successfully before the closure. EM has been observed to be particularly effective when capacity is insufficient compared to traffic demand [1]. However, the system may fail when high demand and gaps are limited [2, 3].
LM is a strategy aimed at minimizing queue length by maximizing the utilization of the entire roadway leading to a construction zone [4]. This involves directing vehicles to utilize all available lanes, and upon reaching the merge point, they must adhere to a “take turn” strategy [1]. The “zipper” strategy, as outlined by Delft University in the Netherlands, requires each driver to maintain a specific distance from the lane drop, directly behind the follower of the driver who initiated the maneuver. When implemented accurately, the LM system has the potential to significantly improve throughput and reduce queue length by as much as 50% [4, 5].
In a study by Venkatesan et al. [6], an approach was proposed to optimize traffic flow using a FORTRAN simulation model. This model determined the optimal merging strategy for vehicles navigating a construction zone with two lanes instead of three. According to the results of their simulations, the most effective merging method for reducing travel time did not involve a significant number of early mergers. Conversely, the LM practice significantly reduced trip time as traffic volume increased.
Beacher et al. [7] employed the microscopic highway simulation model WZSIM to simulate static EM and LM control strategies in a scenario involving a reduction from two to one lane. Their simulations yielded a significant result: providing vehicles with notice of the lane closure led to reduced delays and enhanced productivity within the work zone. This finding has practical implications, as it suggests that early merging, by offering drivers more opportunities to transition into the available lane, can effectively mitigate delays. This, in turn, can lead to increased speed and density in the unobstructed lane, thereby enhancing overall productivity. Comparative analysis between the LM approach and a no-control scenario revealed that only under substantial traffic demand did the LM strategy outperform the no-control scenario. Their simulation analysis, nevertheless, failed to incorporate a comparison between static EM and LM control strategies.
Chatterjee et al. [8] assessed the correlation between work zone capacity values and VISSIM driving behavior parameters in a conventional EM system. In evaluating the impact of lane closure scenarios ranging from two to one with two lanes closed it was determined that the VISSIM parameters CC1, CC2, and SDRF had the most significant influence on work zone throughput.
2.2. Car-following Model
Wiedemann's driver behavior model forms the cornerstone of the VISSIM car-following model. The fundamental concept underlying the car-following model suggests that as a vehicle approaches a slower vehicle in front, the approaching driver will decelerate to preserve a designated safe following distance [9]. Nevertheless, due to the driver's inability to precisely gauge the speed difference with the leading vehicle, an excessive decele- ration may occur, resulting in a reduction in velocity relative to the leading vehicle. Consequently, the driver will continue accelerating to uphold the safety distance [10].
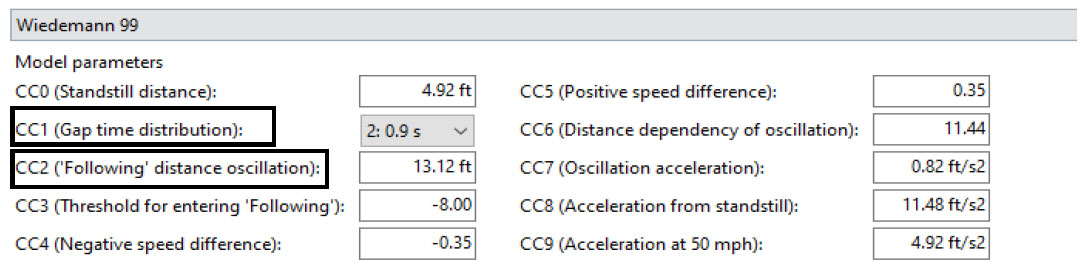
Consequently, the car-following process in VISSIM is characterized by a combination of iterative deceleration and acceleration caused by vehicles whose perceptions of the desired speed, speed difference, and safety distance fluctuate, as well as the unique attributes of each driver and vehicle [10]. To simulate freeway traffic in VISSIM, utilizing the Wiedemann 99 model is advisable. The user can modify ten parameters in this model; these parameters are displayed in VISSIM in Fig. (1) and are briefly described in Table 1.
Due to the requirement that drivers follow other vehicles at a safe distance (i.e., safety distance), safety distance-related parameters (CC0, CC1, CC2, CC4, and CC5) will have a substantial effect on road capacity during periods of heavy traffic demand [11].
Car-following parameters in VISSIM.
| Parameter | Description |
|---|---|
| CC0 | The separation of two stationary vehicles. This distance is constant throughout the simulation. |
| CC1 | The subsequent vehicle's time in seconds of travel. This control factor facilitates determining the desirable safety distance between two moving vehicles. The motorist is required to maintain a greater distance as the value increases. Therefore, a high CC1 signifies cautious driving behavior. |
| CC2 | Distance of variation for a car to follow. This parameter controls the longitudinal oscillation during the subsequent process, wherein the driver maintains a constant speed while following the vehicle in front of them without intentionally decelerating or accelerating. |
| CC3 | The point at which the motorist initiates the following procedure by decelerating. |
| CC4 | The negative velocity differential occurs when the vehicle performs the following process. |
| CC5 | The positive velocity differential occurs when the vehicle performs the following process. |
| CC6 | A parameter that affects the car-following process's response to the influence of distance on speed oscillation. |
| CC7 | The acceleration rate during the oscillation process. |
| CC8 | The acceleration rate is desired when the vehicle decelerates from the stop. The vehicle's maximal acceleration constrains it. |
| CC9 | The acceleration rate is desired when the vehicle is traveling at 80 km/h. The vehicle's maximal acceleration constrains it. |
Lane changing parameters in VISSIM.
2.3. Lane-changing Model
Lane changes are categorized into two distinct categories in VISSIM: necessary and free lane changes. In addition to making necessary lane changes to adhere to a predetermined path (e.g., due to an intersection or lane closure), drivers make free lane changes to achieve the desired speed or take advantage of improved driving conditions in the adjacent lanes. Predetermined gap acceptance criteria determine lane change decisions. These criteria comprise the following: the availability of the gap in the opposite lane, the wish to change lanes, and improved driving conditions [11].
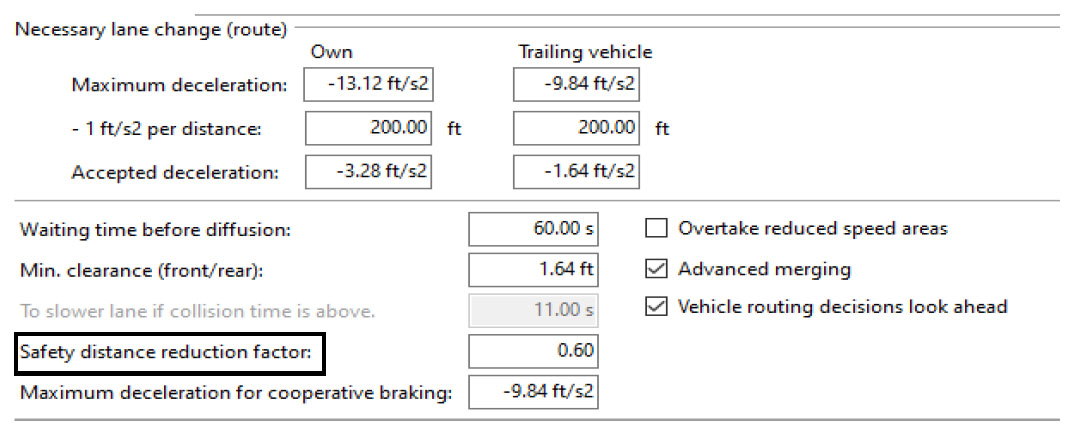
Fig. (2) illustrates the vehicle-specific variables that impact “necessary lane change” behavior: maximum deceleration, maximum deceleration reduction rate, and accepted deceleration. These variables are represented in VISSIM. These variables influence the aggressiveness of the lane-changing driver and the following vehicle. Each driver will begin by decelerating at their accepted deceleration rates. Nevertheless, if the driver changing lanes cannot do so within a specified distance before the final necessary lane change position, they will progre- ssively quicken their deceleration until they achieve their maximum deceleration value. The driver will stop and wait for a potential lane change gap if he cannot change lanes at the final required lane change position. The vehicle will be removed from the network, and an error report will be generated if the stopped lane-changing driver cannot change lanes within the time limit specified by the parameter waiting time before diffusion [11].
Fig. (2) illustrates the additional parameters that influence all lane changes. In this analysis, the adjustment was focused solely on the safety distance, as outlined in the car-following model, which impacts the level of aggression during free lane changes [12]. This adjustment is accomplished by regulating the Safety Distance Reduction Factor (SDRF). SDRF decreases the safety distance defined by the car-following model for both the leading and trailing vehicles until the lane change maneuver is complete [12]. Consequently, the driver executing the lane change becomes more aggressive as SDRF increases.
This study presents findings from a thorough EM and LM strategy analysis using microscopic traffic simulations. The study encompasses meticulous computer simulations of static EM and LM controls in a scenario involving a reduction from two lanes to one, alongside a compre- hensive examination of traffic performance within the work zone area, focusing on metrics such as queue length, delay, and total travel time. Notably, safety considerations are not explicitly addressed in this analysis but will be in subsequent studies. The principal objectives of this study are threefold: firstly, to gain a comprehensive under- standing of the functionality and advantages of EM and LM control through traffic simulations; secondly, to identify simulation parameters that exert influence on the performance of these control systems; and thirdly, to furnish recommendations on the optimal conditions for implementing EM or LM strategies based on simulation outcomes.
The paper is structured as follows: the Methods section introduces the methodology utilized; the Simulation Results and Discussion section analyzes the results; and the Conclusion section summarizes the significant findings of the study.
3. METHOD
3.1. Parameter Selection
The consideration of this study was directed solely toward the parameters deemed to exert the most significant influence on work zone performance, as identified in prior literature. Previous studies [13-16] have collectively established that the parameters CC0, CC1, CC2, CC4, and CC5 within the car-following model, alongside SDRF within the lane-changing model, can substantially impact the estimated capacity of freeway construction zone areas.
The computation of the minimum safety distance is derived as {dx_safe distance, min = CC0 + CC1 × FFS}. Consequently, CC1 exerts a more pronounced effect on the minimum safe distance, mainly when vehicles operate at free-flow speed. Additionally, findings from a study conducted by Chitturi and Benekohal [17] indicate that for CC1 values exceeding 0.8, the contribution of CC0 to capacity becomes negligible. Consequently, CC0 was disregarded in this study, and the minimum value for CC1 was established at 0.9 seconds.
As explained in the literature review subsection, Chatterjee et al. [8] concluded that the VISSIM parameters CC1, CC2, and SDRF were of the utmost impor- tance regarding work zone throughput. Addi- tionally, it was determined that the absolute values of parameters CC4 and CC5 had no statistically significant effect on capacity when they remained below 3.0. Their visual analysis of the simulations determined that an absolute value greater than 3.0 for CC4 and CC5 may result in an incorrect car-following procedure. As a result, the values CC4 and CC5 were excluded from the parameter set utilized in the present study.
Following this, the significant parameters CC1, CC2, and SDRF were chosen for additional analysis. Table 2 specifies the possible values for the three input parameters. During the analyses, the preset values were maintained for all other parameters.
By simulating eight scenarios using the data in Table 2, it is possible to determine which parameter or parameters impact the work zone's throughput under varying traffic demands and the two merge control schemes. As a result, recommendations regarding the optimal conditions under which the EM or LM should be contemplated can be generated based on the simulation outcomes. Table 3 details every conceivable scenario.
| Parameter | Input Values |
|---|---|
| CC1 | {0.9, 2} sec |
| CC2 | {13.12, 20} ft |
| SDRF | {0.2, 0.6} |
| Scenario ID | Input Parameter Values |
|---|---|
| 1 | {0.9, 13.12, 0.6} (More aggressive driver) |
| 2 | {0.9, 13.12, 0.2} |
| 3 | {0.9, 20, 0.6} |
| 4 | {0.9, 20, 0.2} |
| 5 | {2, 13.12, 0.6} |
| 6 | {2, 13.12, 0.2} |
| 7 | {2, 20, 0.6} |
| 8 | {2, 20, 0.2} (Less aggressive driver) |
3.2. Building VISSIM Network
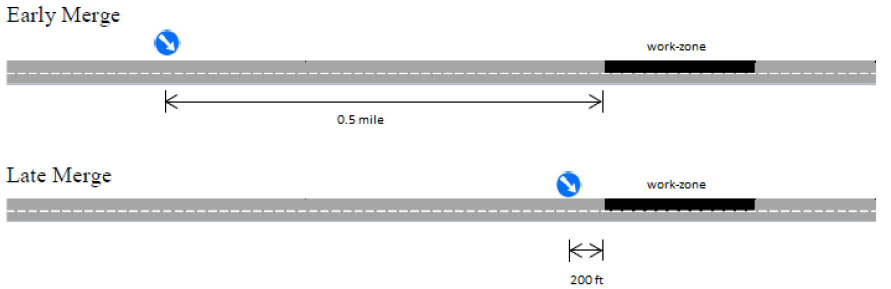
Coding involves the building of the simulation network. The VISSIM model was utilized to evaluate the potential benefits of employing static EM and LM controls in a scenario involving a reduction from two lanes to one within a work zone area. Furthermore, the model aimed to identify the optimal conditions for implementing each control strategy. The configuration of the EM and LM control schemes is depicted in Fig. (3), while their respective VISSIM designs are illustrated in Figs. (4a and 4b).
EM and LM control strategy design.
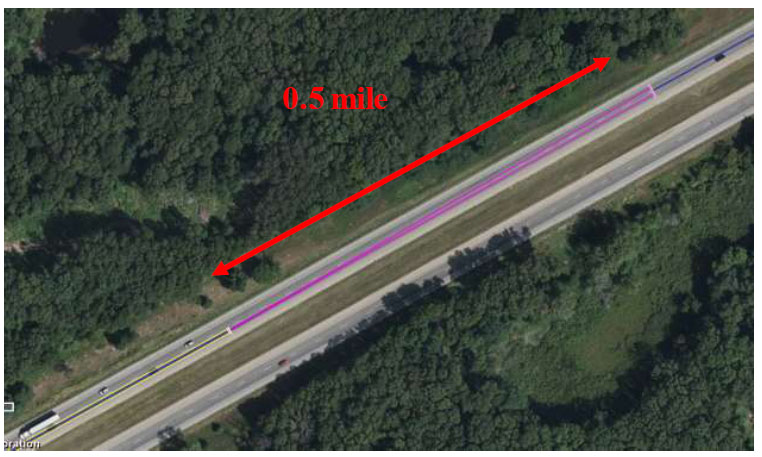
EM VISSIM design.
LM VISSIM design.
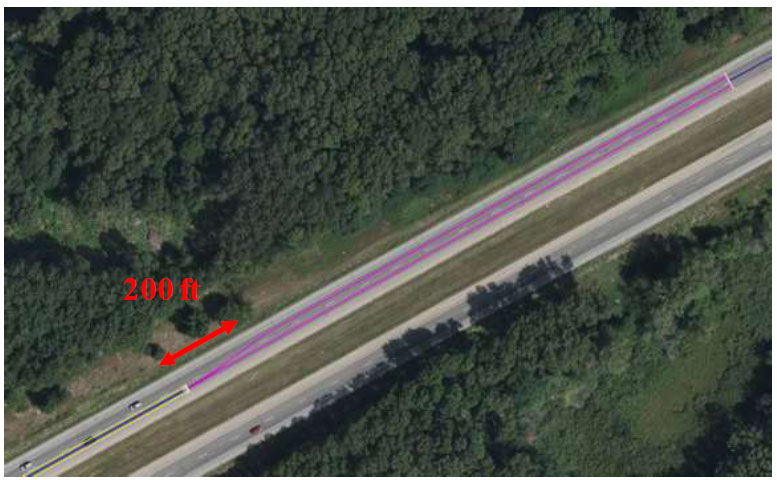
In the EM control scheme, vehicles are directed to merge into the open lane within 0.5 miles upstream of the lane closure. Conversely, in the open lane, vehicles are prohibited from using the closed lane for overtaking until they have passed the work zone area. In the LM scenario, the necessary lane change occurs 200 feet upstream of the work zone; before this point, vehicles are free to utilize both lanes for travel and overtaking. The designated speed limit is 75 mph on the freeway and 55 mph in the work zone. The traffic composition consists of 80% passenger cars and 20% heavy vehicles. The Wiedemann 99 car-following model was employed to replicate freeway driving behavior. Each simulation was executed for a duration of 3600 seconds.
To thoroughly assess the performance of EM and LM controls under varying traffic demand conditions, the vehicle inputs in the simulation were set to range from 2,000 vehicles per hour (veh/h) to 2400 veh/h at increments of 100 veh/h for the freeway segment, and from 270 veh/h to 410 veh/h randomly assumed for the on-ramp segment. These volume inputs are distributed at 5-minute intervals from 0 to 3600 seconds, as depicted in Fig. (5).
3.2.1. Vehicle Travel Time and Delay Measurement
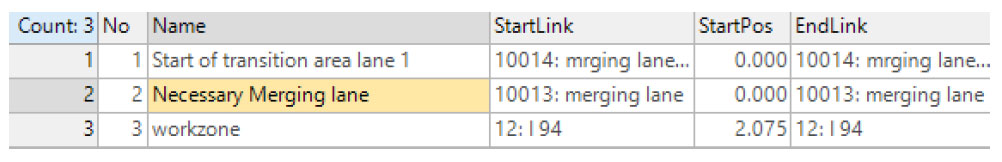
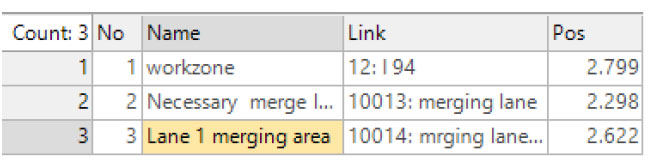
A vehicle travel time measurement encompasses both a “From” and “To” Section. It calculates the mean travel time from traversing the “From” Section to traversing the “To” Section, including any waiting and stop times encountered across all lanes [11]. In our network, three travel time sections were defined, as depicted in Fig. (6a). One was designated for the work zone, while the other two were allocated for the merging areas, as shown in Fig. (6b). On the other hand, delay measurements capture various metrics, including the number of vehicles, average delay, average stop delay, and the number of stops of a turn relation. These measurements may consist of one or several travel time measurements.
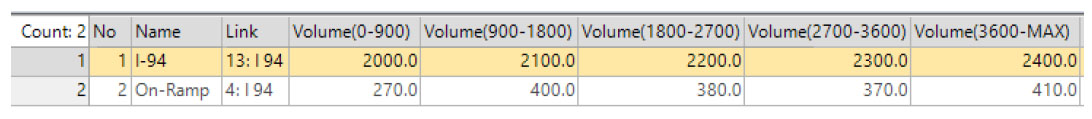
Vehicle volume by time interval in VISSIM.
Travel time sections in EM and LM networks.
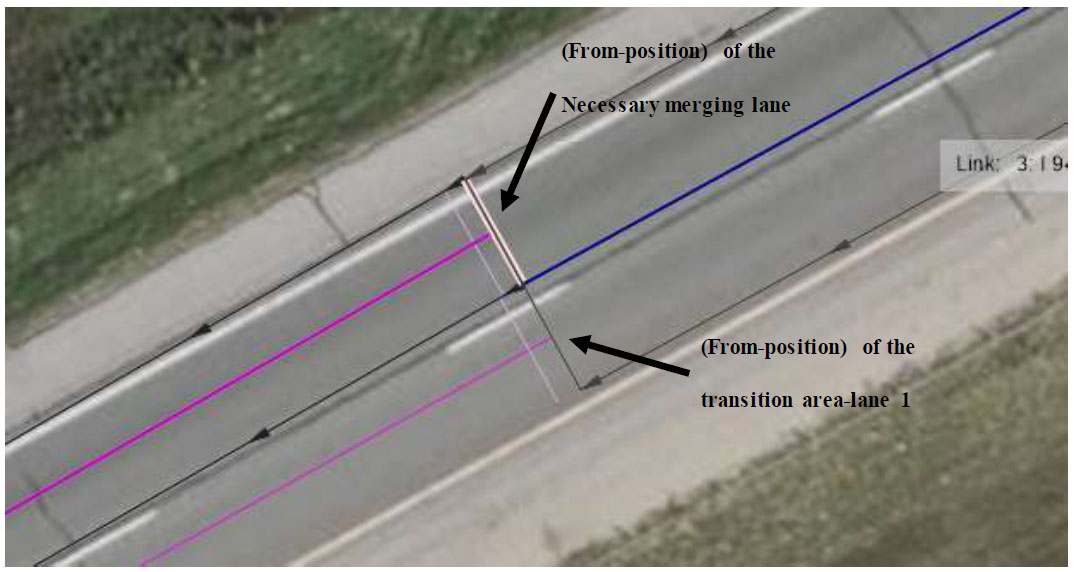
Illustration of travel time sections associated with the merging areas in EM and LM networks.
Queue counter locations in EM and LM networks.
The comparison tree for network scenarios.
3.2.2. Queue Counters
Queue lengths can be determined using queue counters positioned at any location within the VISSIM network and evaluated for specific time intervals [11]. The length of queues is measured from the upstream position of the queue counter up to the last vehicle affected by the queue conditions [11]. In this study, three counters were installed. One was situated at the onset of the closure lane (work zone) to monitor the queue length for each merge control across different scenarios. The second counter was placed at the starting point of the necessary merging lane, and the last counter was positioned adjacent to the second one at the other merging lane, as illustrated in Fig. (7).
By simulating and comparing multiple scenarios, the parameter(s) with the most significant impact on throughput in both merge control approaches were identified. Subsequently, the performance of the work zone (including queue length, vehicle delay, and travel time) under scenarios employing the EM and LM control schemes was compared across various values of the influential parameters. This comparison enabled us to recommend the optimal conditions for implementing either EM or LM strategies.
| Scenario ID | Avg Delay Time per Veh (sec) | Avg # of Stops per Vehicle | Avg Speed (mph) | Avg Stopped Delay per Vehicle (sec) | ||||
|---|---|---|---|---|---|---|---|---|
| EM | LM | EM | LM | EM | LM | EM | LM | |
| 1 | 13.5446 | 16.6451 | 0.0184 | 0.1171 | 50.1392 | 53.7938 | 0.0148 | 0.0858 |
| 2 | 13.1389 | 16.6895 | 0.0226 | 0.1088 | 50.2320 | 53.7113 | 0.0133 | 0.0650 |
| 3 | 16.5226 | 14.0927 | 0.0475 | 0.0723 | 49.8276 | 54.1710 | 0.0401 | 0.0479 |
| 4 | 16.5181 | 13.5952 | 0.0444 | 0.0571 | 49.8535 | 54.3170 | 0.0345 | 0.0396 |
| 5 | 28.1232 | 24.1403 | 0.0677 | 0.0991 | 46.6608 | 49.7129 | 0.0463 | 0.0417 |
| 6 | 27.7657 | 22.8961 | 0.0709 | 0.0736 | 46.7711 | 50.1430 | 0.0447 | 0.0419 |
| 7 | 32.5963 | 21.6655 | 0.2031 | 0.1070 | 45.4799 | 49.8497 | 0.2041 | 0.0648 |
| 8 | 31.0128 | 20.9686 | 0.1937 | 0.0734 | 45.7839 | 49.9864 | 0.1498 | 0.0414 |
| Compared Scenarios IDs | Avg Delay Time per Veh (sec) | Avg # of Stops per Vehicle | Avg Speed (mph) | Avg Stopped Delay per Vehicle (sec) | ||||
|---|---|---|---|---|---|---|---|---|
| EM | LM | EM | LM | EM | LM | EM | LM | |
| 1 with 2 | 0.4057 | 0.0444 | 0.0042 | 0.0082 | 0.0928 | 0.0825 | 0.0015 | 0.0207 |
| 3 with 4 | 0.0045 | 0.4974 | 0.0030 | 0.0152 | 0.0259 | 0.1459 | 0.0056 | 0.0082 |
| 5 with 6 | 0.3575 | 0.6968 | 0.0031 | 0.0336 | 0.1103 | 0.1366 | 0.0015 | 0.0233 |
| 7 with 8 | 1.5834 | 1.2442 | 0.0093 | 0.0255 | 0.3039 | 0.4300 | 0.0542 | 0.0004 |
| Compared Scenarios IDs | Avg Delay Time per Veh (sec) | Avg # of Stops per Vehicle | Avg Speed (mph) | Avg Stopped Delay per Vehicle (sec) | ||||
|---|---|---|---|---|---|---|---|---|
| EM | LM | EM | LM | EM | LM | EM | LM | |
| 1,2 with 3,4 | 6.3571 | 5.6467 | 0.5093 | 0.9654 | 0.6901 | 0.9828 | 0.4647 | 0.6332 |
| 5,6 with 7,8 | 7.7202 | 4.4023 | 0.2582 | 0.7610 | 2.1681 | 0.1972 | 0.2629 | 0.2281 |
| Compared Scenarios IDs | Avg Delay Time per Veh (sec) | Avg # of Stops per Vehicle | Avg Speed (mph) | Avg Stopped Delay per Vehicle (sec) | ||||
|---|---|---|---|---|---|---|---|---|
| EM | LM | EM | LM | EM | LM | EM | LM | |
| 1,2,3,4 with 5,6,7,8 | 59.7737 | 28.6480 | 0.4024 | 0.2100 | 15.3566 | 16.3010 | 0.3421 | 0.4870 |
| Queue Counter Location | Avg Queue Length (ft) | Max Queue Length (ft) | Avg # Of Stops within Queue | |||
|---|---|---|---|---|---|---|
| EM | LM | EM | LM | EM | LM | |
| Work Zone Lane | 2.0576 | 13.7211 | 129.5402 | 366.3676 | 11 | 18 |
| Necessary Merge Lane | 0.0364 | 0.1198 | 21.9524 | 27.0958 | 1 | 2 |
4. RESULTS AND DISCUSSION
4.1. Vehicle Network Performance Evaluation Results
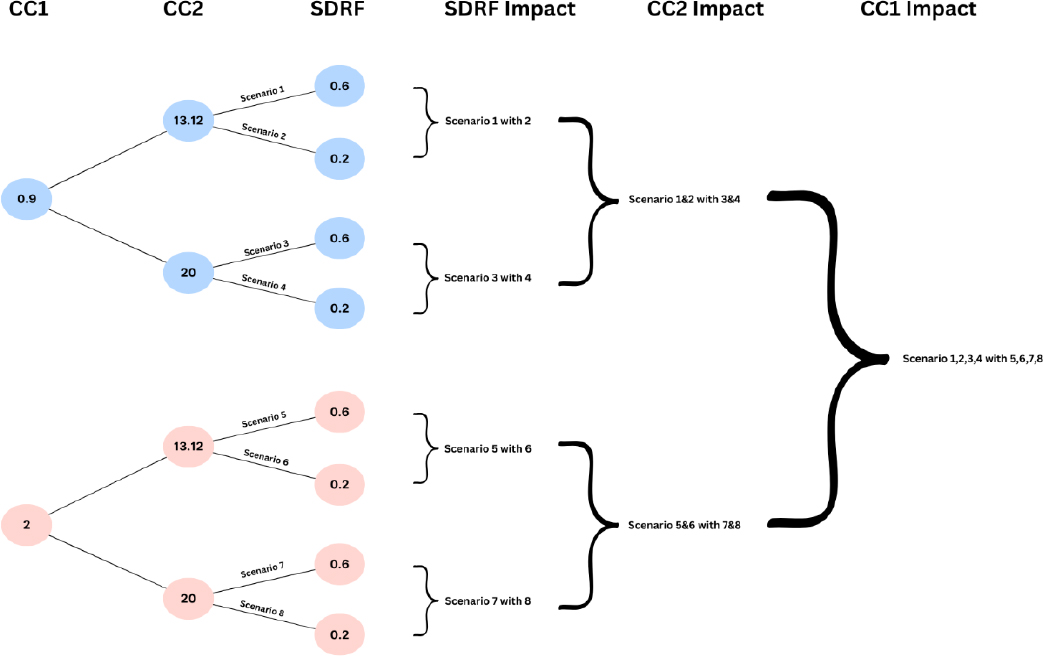
Table 4 presents the results of the network performance evaluation for both merge controls. A comparative analysis of simulation results is conducted for each scenario input to identify the most influential parameters. Specifically, comparing scenarios (1 with 2), (3 with 4), (5 with 6), and (7 with 8) enables assessment of the impact of the Safety Distance Reduction Factor (SDRF) on network performance, as depicted in Table 5a. Similarly, comparing scenarios (1,2 with 3,4) and (5,6 with 7,8) allows for examination of the influence of the CC2 parameter on network performance, as shown in Table 5b. Furthermore, comparing scenarios (1,2,3,4 with 5,6,7,8) helps determine whether CC1 significantly affects network performance, as illustrated in Table 5c. Fig. (8) illustrates the comparison tree for these scenarios. Tables 5a-c indicate that CC1 and CC2 substantially impact the network performance compared to the SDRF parameter.
The comparative analysis highlights the critical role of parameters CC1 and CC2 in simulations utilizing both EM and LM controls. Increasing values of CC1 and CC2 result in decreased work zone throughput in both EM and LM scenarios, as indicated in Tables 5b and c. Additionally, the analysis reveals that the Safety Distance Reduction Factor (SDRF) has a relatively minor impact on network performance for both merge controls, as indicated in Table 5a.
4.2. Average Queue Results for all Scenarios
The EM scenario exhibits a significantly shorter average queue length than the LM scenario. This indicates that the queue in the EM scenario experiences slower growth than the LM scenario. Detailed queue results for both merge strategies are presented in Table 6.
When drivers exhibit aggression and maintain minimal safety distances between vehicles (i.e., low CC1 values), opting for EM control yields advantages such as shorter queue lengths and lower average delay time per vehicle in comparison to LM control. Conversely, implementing EM control is not advisable when drivers are cautious and maintain significant distances from leading vehicles (i.e., high CC1 values). This is because, with LM control, queues tend to grow slower, resulting in shorter average delay times per vehicle than EM control.
CONCLUSION
This study examined the performance of two merge control techniques, static early EM and LM, within a 2-to-1 lane closure work zone on a freeway utilizing the microscopic traffic simulator VISSIM. Simulation results were compared to ascertain the most pertinent VISSIM parameters affecting work zone throughput.
Our findings reveal that the parameters CC1 and CC2 from the car-following model exert more significant influence than the SDRF parameter from the lane-changing model. Specifically, our comparison results indicate that increasing values of CC1 and CC2 lead to decreased work zone throughput in both the EM and LM scenarios. Furthermore, SDRF has a relatively minor impact on network performance for both merge schemes. Additionally, our study suggests that implementing EM control is more suitable for drivers exhibiting aggression and maintaining relatively short safety distances (i.e., low CC1 values). Conversely, when drivers are cautious and maintain longer safety distances (i.e., high CC1 values), adopting LM control is more effective within the work zone area.
Study Limitations and Future Work
While this study offers significant insights into the performance of the merge control strategies within a freeway work zone, it also presents several limitations that merit attention in future research. Our simulations are primarily grounded in conventional vehicles, overlooking the presence or impact of Connected and Autonomous Vehicles (CAVs). The introduction of CAVs, with their advanced communication capabilities and adaptive behaviors, could potentially reshape traffic dynamics, thereby potentially reducing the applicability of our findings to future traffic scenarios.
Another limitation is the reliance on specific VISSIM parameters (CC1 and CC2) to assess the impact on work zone throughput. While these parameters are pivotal, other factors, such as vehicle heterogeneity, driver behavior variability, and environmental conditions, were not extensively investigated. It is imperative to incorporate a wider range of parameters and scenarios in future research to foster a more comprehensive understanding of the effectiveness of merge control techniques. Furthermore, our study concentrated on a specific work zone configuration (2-to-1 lane closure). Diverse configurations, such as multi-lane closures or varying work zone lengths, could potentially yield different outcomes. Future studies should encompass these variations to augment the generalizability of the findings.
To build upon this study's findings, future research should explore the impact of CAVs on merge control techniques in work zones. CAVs can communicate with each other and the infrastructure, leading to more coordinated and efficient merging strategies. Investigating how these vehicles interact with human-driven vehicles under different merge control schemes could provide insights into optimizing traffic flow and safety in mixed-traffic environments.
Moreover, developing and simulating new merge control algorithms designed explicitly for CAVs should be considered. These algorithms could leverage real-time data and predictive analytics to adjust merging strategies dynamically based on current traffic conditions. Another avenue for future work is to conduct field experiments to validate the simulation results. Real-world data can help refine simulation models and ensure the findings apply in practical scenarios. Lastly, considering the varying driver behavior across different regions and cultures, future studies should include a diverse range of driver profiles to better understand the global applicability of the merge control techniques. Extending this research to include another case study dealing with CAVs would be highly beneficial. Such an extension could involve dynamic control models like the lane-based signal merge (LBSM) system, which uses lane-based signals or variable signs to optimize merge operations in work zones. The relevance of this approach is underscored by studies like those by Fan et al. [18], Hussain et al. [19], Nassef et al. [20], and Yuan et al. [21], which offer valuable insights into developing merge strategies using deep reinforcement learning and cooperative lane merging for CAVs.
By addressing and exploring these limitations and future research directions, we can advance our understanding of work zone traffic management and develop more robust and adaptable solutions for the evolving transportation landscape.
AUTHOR CONTRIBUTIONS
The author confirms sole responsibility for the following: study conception and design, data collection, analysis and interpretation of results, and manuscript preparation.
LIST OF ABBREVIATIONS
| EM | = Early Merge |
| LM | = Late Merge |
| SDRF | = Safety Distance Reduction Factor |
AVAILABILITY OF DATA AND MATERIALS
The data supporting the findings of the article is available in the [Annual Average Daily Traffic Maps (AADT Maps)] at [https://experience.arcgis.com/experience/0511 3e1c2c1742a0b07cd22a77b46ee2/page/Michigan-Traffic-AADT/], and [Transportation Data Management System (TDMS)] at [https://mdot.public.ms2soft.com/tcds/tsearc h.asp?loc=Mdot&mod=TCDS], Reference Year: [2021 AADT (Trunkline)].

