All published articles of this journal are available on ScienceDirect.

Research on the Layout of Urban-decentralized Charging Facilities Based on Classification Research Method
Abstract
Background
With the rapid development of electric vehicles in China, there is an imbalance between supply and demand in the layout of decentralized charging facilities in some cities. At present, there is more research on the layout of public fast charging stations, while there is less research on the layout of decentralized charging facilities.
Objective
This study constructs a quantitative model to optimize the urban layout of decentralized charging facilities, addressing the imbalance between supply and demand.
Methods
Based on the classification research method, a predictive model for the distribution of decentralized charging facilities was designed. This model was used to conduct a case study on the planning area of Nantong City, and the carbon emissions and energy saving effects generated by the operation of charging facilities in the area were discussed using comparative analysis.
Results
This study predicted the charging demand for the target year, determined the upper limit, lower limit, and reasonable value of the number of decentralized charging facilities, and determined the number of fast and slow charging devices based on the reasonable value. These charging facilities can effectively meet the charging demand while reducing carbon emissions and urban transportation costs.
Conclusion
This study provides a method for predicting and laying out decentralized charging facilities for urban electric vehicles, which can provide a reference for relevant departments to build decentralized charging facilities in advance to meet the growing demand for charging.
1. INTRODUCTION
In recent years, new energy vehicles, represented by electric vehicles, have grown rapidly in the world. Meanwhile, in recent years, the charging infrastructure has also grown rapidly. The following is the development of electric vehicles and charging stations in major economies around the world:
1.1. China
China is the largest market for electric vehicles in the world, with a total of over 16.2 million electric vehicles and more than 2 million charging stations in 2023, as shown in Fig. (1), and it will occupy a larger proportion in the future. In 2023, the number of electric vehicles in the United States was expected to reach approximately 4 million, with over 120000 charging stations. In the future, federal and state governments will increase investment to improve charging infrastructure.
1.2. Europe
Norway has the highest proportion of the electric vehicle market, with electric vehicle sales accounting for 54% of new car sales in 2023. The overall number of electric vehicles in Europe has reached 3 million, with over 300000 charging stations, especially rapidly growing in Germany and France.
1.3. Japan
The number of electric vehicles in Japan is about 1 million, with nearly 30000 charging stations [1]. Moreover, the government encourages the use of electric vehicles and the construction of charging infrastructure.
However, due to poor planning of charging station construction, these charging stations often cannot meet the charging demand. In some areas, low usage rates lead to resource waste and loss, while some facilities are damaged due to a lack of maintenance. On the contrary, other regions face high charging demand, but there are few devices, resulting in long queues and waiting times.
Charging devices are mainly divided into private charging stations, decentralized public charging stations, and fast charging stations according to their functions. For private charging stations, users usually provide a theoretical pile-to-vehicle ratio of 1:1 when purchasing electric vehicles. If personal parking spaces meet certain conditions, they can be built according to the wishes of the owner, so there is no need for planning. The reason why this article shifts its research focus from fast charging stations to decentralized charging stations is twofold. On the one hand, the service objects of public fast charging stations are operating vehicles and some private vehicles (including a small number of official vehicles). Due to the high charging prices, most of them entail emergency charging. However, in practical situations, based on the convenience and economy of charging, electric vehicle owners are more willing to use slow charging to supplement their vehicles. These slow-charging facilities are decentralized public charging stations, which are scattered in parking spaces or parking lots in various functional areas. Additionally, charging is more convenient and cheap, so the demand for charging is greater. On the other hand, the research on the location and capacity of public fast charging stations has become a hot topic both domestically and internationally, and many experts have conducted comprehensive studies. However, there is relatively little research on decentralized charging stations, so this study has a certain supplementary role in the construction of decentralized public charging stations.
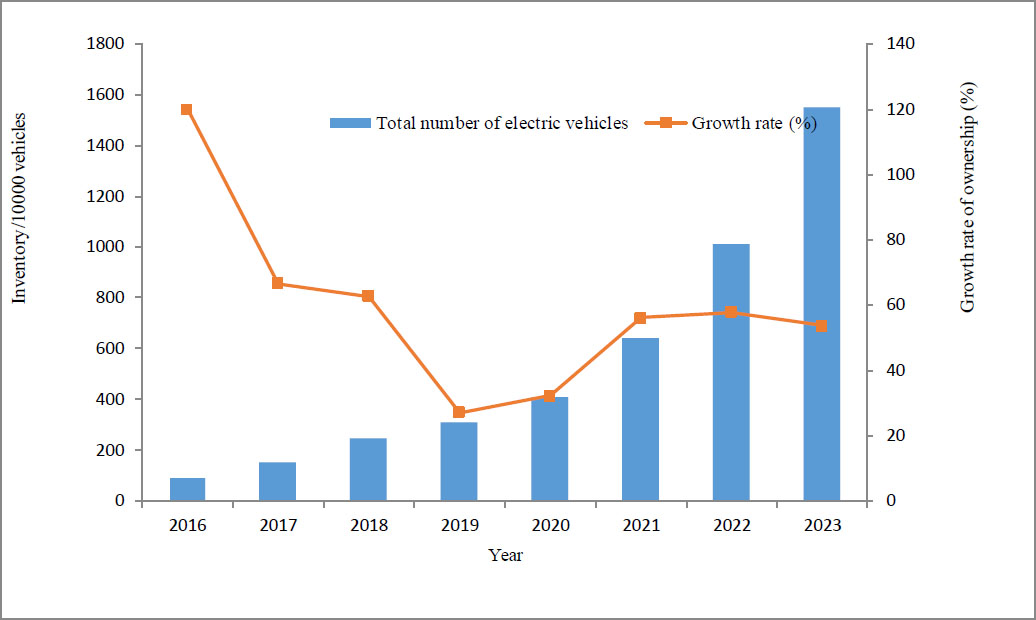
The number and growth rate of electric vehicles in China from 2016 to 2023. Data source: China Association of Automobile Manufacturers.
By arranging charging facilities reasonably, the charging needs of electric vehicles can be met. In the long run, it can promote the popularization of electric vehicles, reduce urban air pollution and carbon emissions, and promote the optimization of urban energy structures. At the same time, we hope to provide reference opinions for relevant departments to plan charging facilities reasonably.
2. LITERATURE REVIEW
2.1. Study Framework
This article mainly studies the layout problem of urban decentralized charging stations and proposes a planning idea and method based on the actual planning purpose. This method takes the planning area of Nantong City as an example and, through comparative analysis, explores the carbon emissions and energy-saving effects generated by the operation of charging facilities in the area. The research framework of this article is shown in Fig. (2).
Firstly, the charging demand for electric vehicles was predicted. Based on the feasibility and convenience of data collection, target indicators for the next year were used to control the trend of the fitting curve. This will allow for predicting the charging demand, including the number of electric vehicles and the total charging demand (charging capacity and number of charging vehicles).
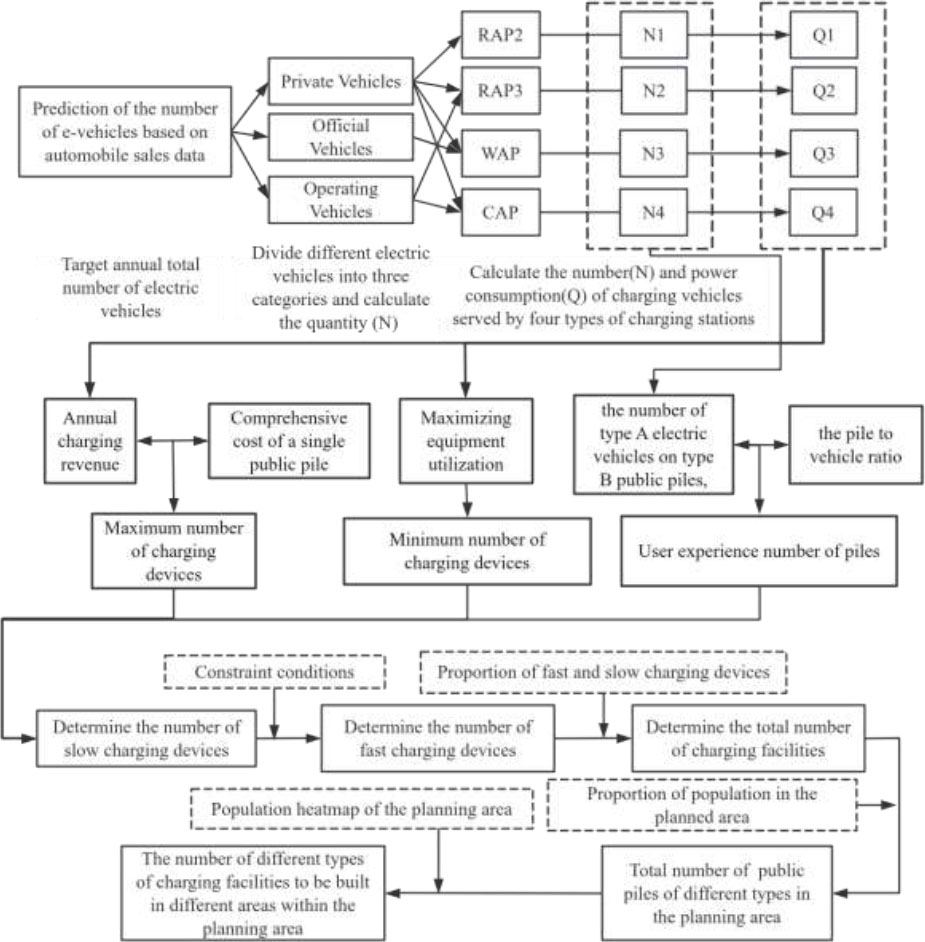
The research framework.
Then, based on charging demand and user experience, a public decentralized charging station quantity planning optimization model and a heuristic solution method based on charging demand and user experience were proposed for the quantity planning of decentralized public charging stations. Finally, the model was validated using data from the planning area of Nantong City, Jiangsu Province, and construction planning schemes for each region were obtained. The environmental and economic benefits generated by the operation of charging facilities were discussed.
2.2. Area Studied
Nantong is a prefecture-level city under the jurisdiction of Jiangsu Province, one of the core cities in the Yangtze River Delta, and also a national comprehensive transportation hub, which is shown in Fig. (3). By the end of 2023, the permanent population of Nantong City was 7.7485 million, including a population of 1.58 million in the main urban area, with a land area of 8001 km2 and a regional GDP of 118.133 billion yuan. The population size and economic development level of Nantong City are representative of many second tier cities in China. Its urban infrastructure construction is relatively complete. As one of the top ten cities for demonstration and promotion of new energy vehicles, Nantong has always actively responded to the national call and steadily and effectively promoted the application of new energy vehicles. In the past three years, Nantong City has built about 15000 public charging stations and about 2900 dedicated charging stations in the central urban area, basically forming a comprehensive public charging service network that meets the development needs of new energy vehicles. In addition, Nantong City also plans to fully establish a new energy vehicle intelligent charging network by 2035, which is committed to building Nantong into a demonstration city for charging and swapping infrastructure, known as a “leading city in the province and a first-class city in the country”. It can be seen that this city, like other medium-sized cities in China, has similar urban scale and infrastructure, and has good government policy support. Therefore, this article selected Nantong as the research area, which can provide a reference for the development of charging facilities in other similar cities.

Map of Nantong city.
2.3. Research on Demand Forecasting for Electric Vehicle Charging
At present, research on the layout planning of electric vehicle charging facilities mainly includes two aspects [2] first, making reasonable predictions on the charging demand in the planning area, and second, configuring the charging facilities in the corresponding area based on the prediction results.
In recent years, many scholars have studied the prediction of electric vehicle charging demand. A previous study [3] predicted the number of electric vehicles based on factors, such as car ownership, policies, and economy but did not consider the temporal and spatial distribution of charging demand [4]. In another study [5], the charging demand for electric vehicles was calculated based on the sales volume of gas stations. Although spatial distribution is considered, it may not be realistic to assume that users will go to charging facilities near gas stations. Another study [6] predicted the daily charging demand of different types of electric vehicles based on the number of motor vehicles and the penetration rate of electric vehicles, and allocated emergency charging demand in conjunction with traffic flow, but did not consider the impact of parking lots.
Furthermore, another study [7, 8] analyzed the spatial distribution of charging demand using transportation networks and traffic flow. Due to the high randomness of electric vehicle charging behavior, existing research generally uses Monte Carlo simulation to analyze the time distribution of charging power [9] while using methods, such as parking generation rate models, to study spatial distribution. However, these research methods often struggle to obtain a large amount of accurate data on electric vehicle travel and charging.
2.4. Research on Layout Planning of Charging Facilities
Many experts have conducted comprehensive research on the location and capacity of public fast charging stations. In 2011, Zhou Hongchao [10] proposed a game theory-based evaluation method for alternative plans for EV charging stations to determine the final planning layout. In 2015, Liu Kai [11] proposed improvements for the P-median model and the interception site selection model, exploring multi-objective optimization models and dynamic layout optimization models and methods. In 2019, Cai Xiaoyao [12] proposed a genetic algorithm that was designed and used for modeling and solving by combining cost and user experience factors. Other researchers [13] proposed a hybrid approach in 2021, which evaluated the suitability of constructing EV charging points on urban roads through a systematic review of relevant literature and interviews with 12 structured stakeholders, combined with an Analytic Hierarchy Process (AHP). In 2023, Huang Wenrui [14] stated that by using battery SOC value and driving range as influencing factors, a genetic algorithm was used to optimize the coordinate position of charging stations, and a comprehensive evaluation was conducted to determine the lowest cost plan for constructing the number of charging stations.
Decentralized charging stations are generally located in public parking spaces, with slow charging speeds, high and scattered charging demands, and a lack of centralized scale. If the construction cannot be planned in advance, it will lead to an imbalance between supply and demand, and cannot meet the charging demand. Meanwhile, there are relatively few relevant literature. A study [15] analyzed different types of travel and charging characteristics, such as private cars, taxis, and buses. Another study [16] suggested determining the number or distribution density of decentralized charging stations based on charging demand. A different study [17] analyzed residential areas and public charging stations, suggesting that residential charging stations should be built based on the popularity and ownership of electric vehicles, while public charging stations should optimize charging distance and station capacity based on the distribution of vehicle ownership and charging demand. In addition, the layout of charging stations can also optimize energy efficiency, which has been studied by many researchers. For instance, one study [18] analyzed the impact of the layout of electric vehicle charging stations on the utilization of renewable energy, emphasizing the importance of layout optimization in promoting the use of green energy.
With the popularity of electric vehicles, the planning of charging facilities is receiving increasing attention. However, existing research mostly adopts mathematical optimization or intelligent algorithms, mainly focusing on the layout of fast charging stations. There is relatively little research on decentralized charging piles, and there are practical problems, such as insufficient consideration of factors, difficult data acquisition, and unstable algorithms. Therefore, there is an urgent need to study practical planning ideas and methods.
3. METHODS
This section establishes prediction models for the number of different types of electric vehicles, as well as calculation models for the number of decentralized charging facilities (fast charging piles and slow charging piles).
3.1. Prediction of Electric Vehicle Ownership
The prediction method based on automobile sales data is as follows:
Firstly, future annual car sales volume was predicted. Then, car sales data from the past five years were collected. Regression analysis or trend extrapolation methods were used to fit the data, a fitting function was obtained with a curve and then future annual sales volume based on this function was predicted.
Secondly, the annual sales proportion of electric vehicles in the future was predicted. Then, the proportion of electric vehicle sales was investigated in the region to total sales, referred to as the “Energy Saving and New Energy Vehicle Technology Roadmap 2.0” and regional development plans, and regression analysis was conducted based on historical and long-term data to predict the future sales proportion of electric vehicles.
Finally, the number of electric vehicles in the target year was predicted based on the predicted annual car sales volume and electric vehicle sales ratio, as well as the current electric vehicle ownership. The number of electric vehicles in the region in the target year was estimated [19] (Eq. 1).
 |
(1) |
In the formula,
 and
and
 represent the number of electric vehicles in the ith year and the current year; Aj and B are the sales volume of automobiles in the jth year and the corresponding proportion of electric vehicle sales volume; and Cj is the number of retired electric vehicles in the jth year, which can be obtained based on statistical data on the lifespan of electric vehicles [20].
3.2. Prediction of the Quantity of Electric Private Cars, Electric Operating Vehicles, and Electric Official Vehicles
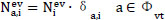
Firstly, the proportion of private cars, government cars, and operating cars in electric vehicles in recent years was investigated. Then, based on the relevant policies of the planning area and the development trend of electric vehicles, the proportion of various types of electric vehicles in the total number of electric vehicles in the target year was estimated. Finally, the specific number of various types of electric vehicles in the planning area for the ith year was calculated (Eq. 2).
 |
(2) |
In the formula, a represents the type of electric vehicle; Φvt is a collection of electric vehicle types;
 is the number of type A electric vehicles in the ith year; and δa,i represents the proportion of Type A electric vehicles in the total number of electric vehicles in the ith year [20].
3.3. Prediction of the Number of Different Electric Vehicles with Different Charging Facilities
Charging facilities can be categorized in several ways. They can be classified into slow and fast charging based on power and charging time [21]. In terms of usage, they are divided into private and public charging stations. Urban charging facilities include private, public, and fast charging options [22], as shown in Table 1.
Based on the analysis of the driving and charging behavior characteristics of private cars, buses, official vehicles, and operating vehicles, a survey was conducted on the proportion of charging vehicles of different types of electric vehicles at different charging facilities to the total number of electric vehicles of that type. The number of different types of electric vehicles at different charging facilities in the planning area in the ith year was [23] (Eq. 3):
 |
(3) |
In the formula, b is the type of charging device, and Φp,t is the set of charging device types;
 is the number of type A electric vehicles on type B public piles in the ith year; and γa,b is the proportion of type A electric vehicles charging at type B charging facilities. For any type of electric vehicle, the sum of the ratio of charging vehicles in different types of charging facilities is 1; that is, the ratio of charging vehicles a and b should meet as follows (Eq. 4):
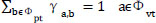 |
(4) |
3.4. Prediction of Total Charging Electricity Demand
The demand for charging power includes the daily average charging power demand of different types of electric vehicles, as well as the daily average charging power demand of different electric vehicles on different charging facilities [24].
| Type | Location | Name (Number) | Power (kw) |
Service Life (year) |
|---|---|---|---|---|
| Private charging pile | Residential parking lot | Residential private pile (RAP1) | 3.5 | 10 |
| Public charging pile | Residential parking spaces | Residential area public piles A (RAP2) | 3.5 | 10 |
| Residential area | Public piles B (RAP3) | 7 | 15 | |
| Work Area | Public piles (WAP) | 7 | 15 | |
| Commercial area parking lot | Commercial area public piles (CAP) | 7 | 15 | |
| Public fast charging pile | Road node or line | Public fast charging station (FCS1) | 60 | 20 |
| Dedicated parking lot | Dedicated charging station (FCS2) | 60 | 20 |
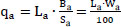
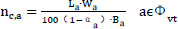
Based on the travel characteristics, application scenarios, and relevant parameters of different types of electric vehicles, combined with the predicted number of different types of electric vehicles, the daily charging electricity demand for different types of electric vehicles in the ith year is calculated as follows (Eqs. 5-7):
 |
(5) |
 |
(6) |
 |
(7) |
In the formula, Qa,i represents the daily average charging demand of type A electric vehicles in the ith year of the planned area; qa is the daily average charging power demand of a single type A electric vehicle; nc,a is the daily charging frequency of type A electric vehicles; αa is the percentage of remaining battery power before charging the vehicle; La and Sa are the daily driving range, battery capacity, and range of type A electric vehicles, respectively; and Wa is the power consumption per 100 kilometers of type A electric vehicles.
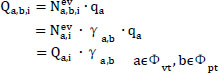
According to the analysis, the same type of electric vehicle will use different types of charging facilities for charging. Therefore, based on the predicted number of electric vehicles on various charging facilities, the corresponding daily charging electricity demand can be calculated as follows [25]:
 |
(8) |
In the formula, Qa,b,i represents the daily average charging demand of type A electric vehicles on type B charging facilities in the ith year.
According to Eq. (8), it can be seen that the daily average charging power demand of type A electric vehicles on type B charging facilities is Qa,b,i, which can also be expressed as the product of the daily average charging power demand of type A electric vehicles, which is Qa,i, and the proportion of charging vehicles on type B charging facilities, which is γa,b [26].
3.5. Capacity Planning for Public Charging Equipment
3.5.1. STEP: 1 Maximum Pile Count Calculation
This section aims to achieve a cost-benefit balance over the service life of the equipment and calculate the maximum allowable number of public charging facilities [27]. First, the total charging revenue for public charging stations is calculated based on the number of electric vehicles and their power requirements. Next, the comprehensive cost of a single charging pile is determined [28]. Finally, the cost benefit balance method is used to find the maximum allowable number of public charging piles for that type.
3.5.1.1. Definition of Maximum Allowed Number of Piles
The method assesses whether a project can withstand these changes by determining critical values. During the service life of a charging station, if the total charging revenue of a public station exceeds its investment cost, adding another station would not recover all costs [29]. At this point, this number represents the maximum allowable number of public charging piles for that type.
3.5.1.2. Calculation of Annual Charging Revenue for Public Piles
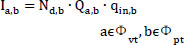
The annual charging revenue of public piles refers to the revenue obtained through electricity sales, which can be expressed as follows:
 |
(9) |
In the formula, Ia,b represents the annual charging revenue of type A electric vehicles on type B public piles; Nd,b is the average annual operating days of type B public piles; and Qa,b is the daily average charging power demand of type A electric vehicles on type B public piles. Assuming that their daily charging power demand is the same, Qa,b can be calculated using Eq. (8); qin,b is the profit per unit of electricity sold by type B public piles.
3.5.1.3. Comprehensive Cost Calculation of a Single Public Pile
The comprehensive cost of a single public pile consists of two parts [19]: fixed cost and variable cost. Among them, fixed cost refers to the fixed investment cost of a single public pile, and variable cost refers to the operation and maintenance management expenses of a single public pile during its service life. The formula for calculating the comprehensive cost of a single pile is obtained as follows:
 |
(10) |
In the formula, Cb represents the comprehensive cost of a single type-B public pile; Cin,b is the fixed investment cost of a single type B public pile; ky is the coefficient of operation and maintenance costs; and Yb is the service life of type B public piles.
3.5.1.4. Calculation of the Maximum Allowable Number of Piles
According to Eqs. (9-10), given the annual charging revenue Ia,b and the comprehensive cost of a single pile Cb, it can be concluded that the maximum allowable number of public piles for type B electric vehicles should be configured for type A electric vehicles (Eq. 11).
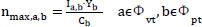 |
(11) |
3.5.2. STEP 2: Minimum Pile Count Calculation
3.5.2.1. Definition of the Minimum Allowed Number of Piles
This section aims to maximize the utilization of charging equipment by defining the minimum allowable number of public charging facilities as follows: within a day, assuming that a certain configuration of charging facilities continuously provides uninterrupted charging services, it can meet the charging needs of all users. In addition, when reducing one more charging station cannot meet all the needs, this quantity is the minimum allowable number of public charging facilities of that type.
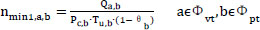
3.5.2.2. Calculation of the Minimum Allowable Number of Piles
Based on the above definition and analysis, the minimum allowable number of charging facilities that a certain type of electric vehicle should be equipped with can be calculated according to the charging power of different types of public charging facilities, the longest daily service period, and the charging demand of each type of electric vehicle (Eq. 12).
 |
(12) |
In the equation, Qa,b can also be calculated from Eq. (8); Pc,b is the charging power of type B public piles, with specific values shown in Table 1 and Tu,b and θb are the daily average available time and allowable equipment idle rate of type B public piles, respectively.
3.5.3. STEP: 3 Calculation of the Number of Piles for User Experience
Currently, public charging facilities primarily use slow charging, leading to longer charging times and range anxiety among users. Consequently, acceptance of the remaining state of charge (SOC) varies by individual. This section calculates the ratio of decentralized charging facilities to determine the distribution of different public charging types for various electric vehicles. By combining this with the number of electric vehicles at each charging facility, we can establish the minimum required number of user-friendly charging facilities.
3.5.3.1. Estimation of Pile-to-car Ratio for Private Cars
Considering the psychological acceptance level of users towards the remaining SOC and the convenience of charging in different construction sites, this article calculates the probability of charging demand for different functional areas (work area, commercial area, leisure, and entertainment area) based on the single driving mileage data from the American Household Travel Survey NHTS2009 [30]. The typical pile-to-vehicle ratio for vehicles in the ranges of 100km, 150km, and 200km is given. Considering that subsequent cases only involve data on an electric vehicle range of 200 kilometers, only the pile-to-vehicle ratio for this range is listed here. The specific data are detailed in Table 2.
3.5.3.2. Proportion of Charging Facilities for Different Types of Electric Vehicles
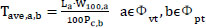
Table 2 only shows the ratio of charging facilities for private cars and does not involve the ratio of official and operational vehicles. Due to the correlation between the ratio of charging facilities and the daily charging time of vehicles [31], we calculated the ratio of charging facilities for official and operational vehicles based on the ratio of private cars, as shown in Table 2, and the daily charging time of different types of electric vehicles. The corresponding ratio conversion formula is as follows (Eqs. 13-16):
 |
(13) |
 |
(14) |
 |
(15) |
 |
(16) |
In the formula, ωpr,b, ωof,b and ωop,b respectively represent the pile-to-vehicle ratio of type B public piles to private cars, official cars, and operating cars; σ1,b and σ2,b are the conversion coefficients for the ratio of type B public piles to government vehicles and operating vehicles; Tave,prf,b, Tave,of,b and Tave,op,b represent the average daily charging time of private cars respectively, government vehicles, and operating vehicles on type B public piles; W100,a represents the average daily mileage and power consumption per 100 kilometers of type A electric vehicles; and P,b represents the charging power of type B charging facilities.
3.5.3.3. Calculation of Minimum Allowable Number of User Experience Piles
Based on the predicted number of different electric vehicles for different public piles in Table 3 and the corresponding pile-to-vehicle ratio, the minimum allowable number of user experience piles for type B public piles, which should be configured for type “A” electric vehicles, is calculated as follows (Eq. 17):
 |
(17) |
In the formula, ωa,b is the pile-to-vehicle ratio between type “B” public piles and type “A” electric vehicles, as shown in Table 3;
 is the number of type A electric vehicles on type B public piles, and their calculation is shown in Eq. (3).
3.5.4. STEP: 4 Determination of the Planned Quantity of Slow Piles
3.5.4.1. Constraint Conditions
The optimization model for planning the number of public charging facilities in this article aims to minimize the number of public charging facilities, with the corresponding number of stations that meet charging needs, user psychology, and economic rationality as constraints [31] (Eq. 18):
 |
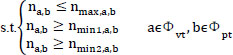 |
(18) |
In the formula, Φv,t is the set of electric vehicle types heading to public piles and Φv,t ϵ {pr, of, op}; Φpt is the set of public pile types, Φpt ϵ {RAP2, RAP3, WAP, CAP}; na,b is the planned optimized number of type-B public piles that should be configured for type-A electric vehicles; nmax,a,b is the maximum allowable number of common piles that type A electric vehicles should be equipped with from type B; nmin1,a,b is the minimum allowable number of type-B public charging facilities that should be configured for type-A electric vehicles; and nmin2,a,b is the minimum allowable number of user experience stations that type A electric vehicles should be equipped with from type B public stations.
Based on the calculated maximum and minimum numbers of piles, as well as the user experience piles, combined with the objectives and constraints of Eq. (18), the maximum minimum comparison method is used. If the number of piles is lower than the minimum number or the number of user experience piles, then the model (18) has no solution. Otherwise, the larger value is chosen between the minimum number of piles and the number of user experience piles as na,b.
3.5.5. Step: 5 Determination of the Planned Quantity of Fast Piles
Based on the ratio of fast and slow piles in different functional areas in Table 2, the planned quantity of slow piles in each type of public pile can be multiplied by their corresponding ratio to obtain the planned quantity of fast piles.
| Type of Functional Area | Pile-vehicle Ratio | Proportion Ratio of Fast and Slow Piles |
|---|---|---|
| Residential area | 1 | 0.06 |
| Work area | 0.36 | 0.06 |
| Commercial area | 0.40 | 0.08 |
3.6. Data Input and Analysis
This section takes the planning area of Nantong City, which is in Jiangsu province of China, as an example to investigate, collect, and organize relevant data and use the above model for calculation.
The main data used in predicting the number of cars in the target year are as follows:
• From 2017 to 2024, the ownership and sales data of fuel and electric vehicles in Nantong, including the number of electric vehicles owned and sold in selected years, were used.
• The “China Automotive Market Medium - and Long Term Forecast Report (2020-2035)” released by the China Association of Automobile Manufacturers, which outlines the national automotive sales growth rates for the next 5, 10, and 15 years, was used.
• According to the relevant policy documents of “Energy Conservation and New Energy Vehicle Technology Roadmap 2.0”, it was found that the sales proportion of new energy vehicles should reach 20% and 50%, respectively, by 2025 and 2035.
• The current proportion of private cars, government cars, commercial cars, and other types of vehicles was used.
• The choice of charging facility by car owners is influenced by various factors, including driving characteristics, charging characteristics, and type of charging facility [32]. Based on a previous study [33] and the usage habits of car owners in Nantong City, the proportion of private cars, government vehicles, and operating vehicles charging at different types of charging facilities was determined.
3.6.1. Assumption
• The growth rate of automobile sales in Nantong City in the next 5, 10, and 15 years will match the local economic growth rate during the same period, which will be 3.0%, 3.5%, and 3.0%, respectively.
• Considering the actual development of the automobile industry of Nantong, it is expected that the sales proportion of new energy vehicles will be 50% and 80% in 2025 and 2035, respectively.
• The proportion of private cars, government cars, commercial cars, and other types of vehicles in the target year is basically the same as currently, at 90%, 0.747%, 0.361%, and 8.892%, respectively.
The main data used in determining the number of decentralized public charging facilities are as follows:
• The number of different types of electric vehicles on different charging facilities was obtained in the previous section.
• From a study [19] showing the sales volume and types of mainstream pure electric passenger vehicles (including electric sedans, SUVs, and commercial vehicles) in China from 2020 to 2023, 9 vehicles with higher market share were selected from the middle, and their battery capacity, range, and power consumption per 100 kilometers were input into the model for calculation.
• The basis for determining driving and charging parameters was a survey questionnaire from local car owners. The questionnaire shows that the average daily mileage of private cars, government cars, and operating cars in the city is about 50 kilometers, 70 kilometers, and 450 kilometers, respectively. Most drivers prefer to charge and fully charge their batteries when they are between 20% and 30% charged in order to maintain battery health and meet daily endurance needs.
• The relevant parameters of charging facilities were sourced from local operating enterprises in Nantong City (fixed costs, operating costs, service fees, vacancy rates, power supply, and service life of charging piles, etc.).
• Based on the single trip mileage data from the NHTS2009 household travel survey in the United States [30], this article calculates the probability of charging demand in different functional areas (work area, commercial area, leisure, and entertainment area). It provides typical pile-to-vehicle ratios for vehicle travel distances of 100km, 150km, and 200km.
• A population distribution heatmap of the planned area based on Baidu Maps API was obtained, as shown in Fig. (11). The distribution density of the population in the area was determined, and the population proportion of the area was estimated [34]. Fig. (12) is a schematic diagram of the planning area in Nantong City, indicating the number and location of each demand point.
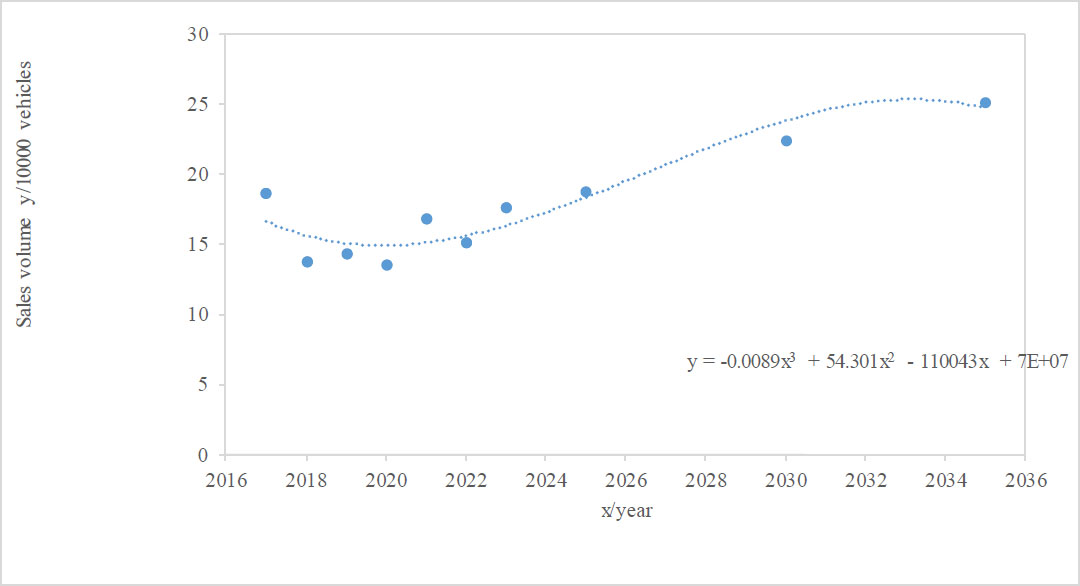
Fitting curve of automobile sales volume. Data source: China Association of Automobile Manufacturers.
3.6.2. Assumption
• The battery capacity and range parameters for the target year are the same as currently.
• The usage and charging habits of different types of electric vehicles in the target year are consistent with the current ones.
• In the target year, the vehicle range is relatively long. This article uses typical pile-to-vehicle ratio data of 200km vehicle mileage for calculation.
• The population proportion in the planning area of Nantong City in the target year remains the same as it is now.
• The per capita occupancy rate of charging facilities in the region is the same, and the distribution rate of charging facilities is equal to the population distribution rate [35].
4. RESULTS
This section presents the results of the above model calculations, which are mainly divided into two parts. The first part is the predicted number of different types of electric vehicles in the target year, and the second part is the predicted number of decentralized charging piles. Based on user satisfaction conditions, a reasonable number is given. Taking a planning area in Nantong City as an example, the specific number of charging piles for each area in the planning area is given.
4.1. Forecast Results of the Number of Electric Vehicles in the Target Year
Firstly, based on the historical data of automobile sales, a fitting function is obtained, as shown in Figs. (4-5)., and the sales quantity and total amount of electric vehicles from 2025 to 2035 are predicted according to the function. The result is shown in Fig. (6).
Fig. (7) shows the number of vehicles of various types in the target year of Nantong City. It can be seen from the figure that private cars account for the highest proportion, about 90%, followed by other vehicles, official vehicles, and operating vehicles.
Fig. (8) shows the number of private cars, commercial vehicles, and operational vehicles charging at residential charging facilities 2 and 3, work area charging facilities, and business area charging facilities. It can be seen from the figure that private cars tend to charge more in residential areas, commercial vehicles charge in work areas, and operational vehicles charge in business areas.
4.2. Forecast Results of the Number of Electric Vehicles in the Target Year
Firstly, the maximum value of the number of charging stations can be obtained by inputting the data, such as the number of electric vehicles in the previous section, into formula 9-11, the minimum value can be obtained by inputting formula 12, and the minimum value under user satisfaction conditions can be obtained by inputting formulas 13-17, which is the reasonable value. As shown in Fig. (9), by introducing constraint condition 18 and using the method of comparing the maximum and minimum values, the results satisfy the model constraint conditions. Reasonable values are used to determine the final number of slow charging facilities in the planning area, and the number of fast charging piles is proportionally determined, as shown in Fig. (10). According to Fig. (10). Nantong City needs to plan a total of 407,600 public charging facilities by 2035, including 383,800 slow piles and 23,800 fast piles. The slow piles comprise 216,800 residential public piles A (RAP2), 77,600 residential public piles B (RAP3), 71,000 work area public piles (WAP), and 42,200 commercial area public piles (CAP). The ratio of planned public charging piles to electric vehicles in the city is 1:4.65, with a requirement that this ratio be at least 1:8 for cities promoting new energy vehicles [36].
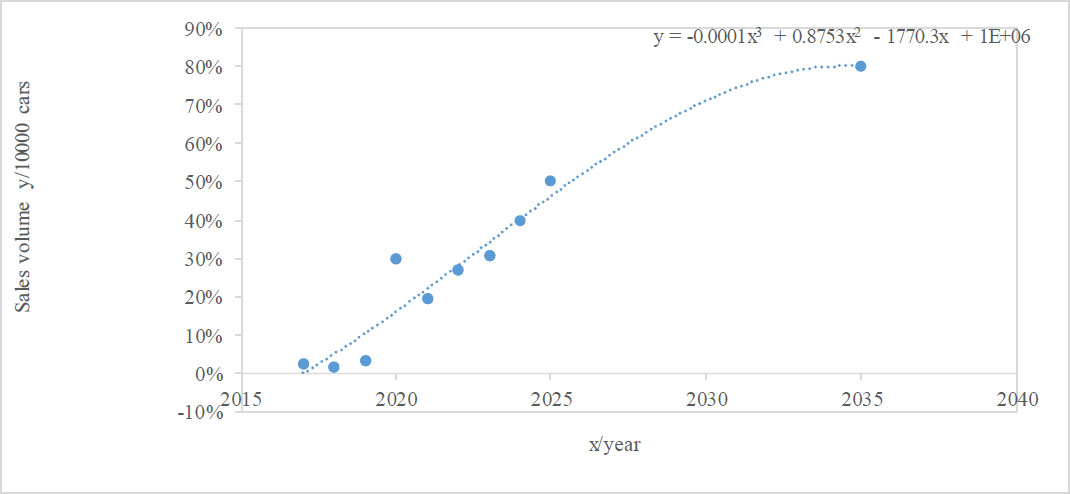
Fitting curve of EV sales proportion. Data source: China Association of Automobile Manufacturers.
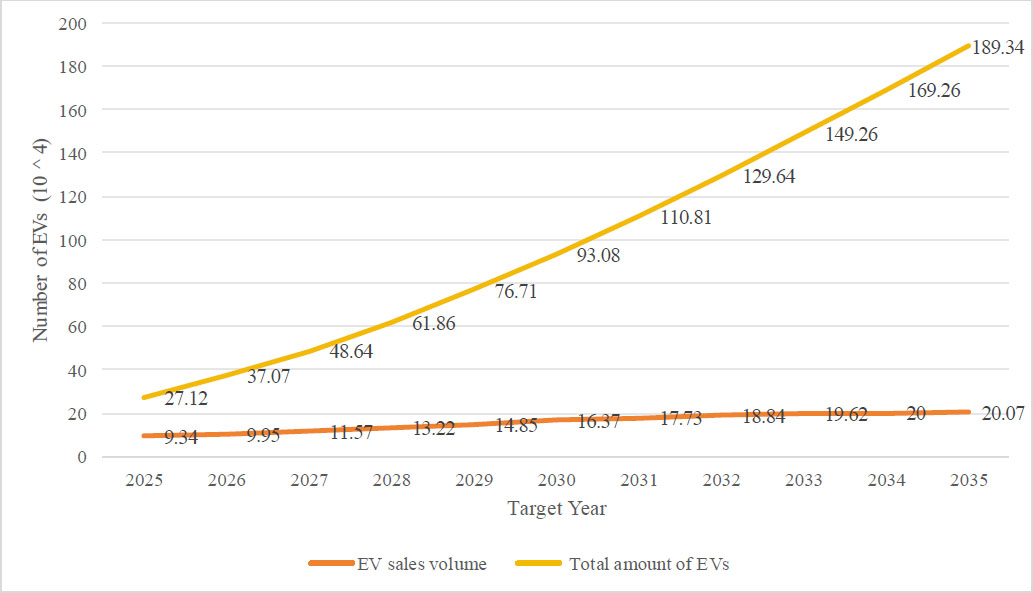
The sales quantity and total amount of electric vehicles from 2025 to 2035.
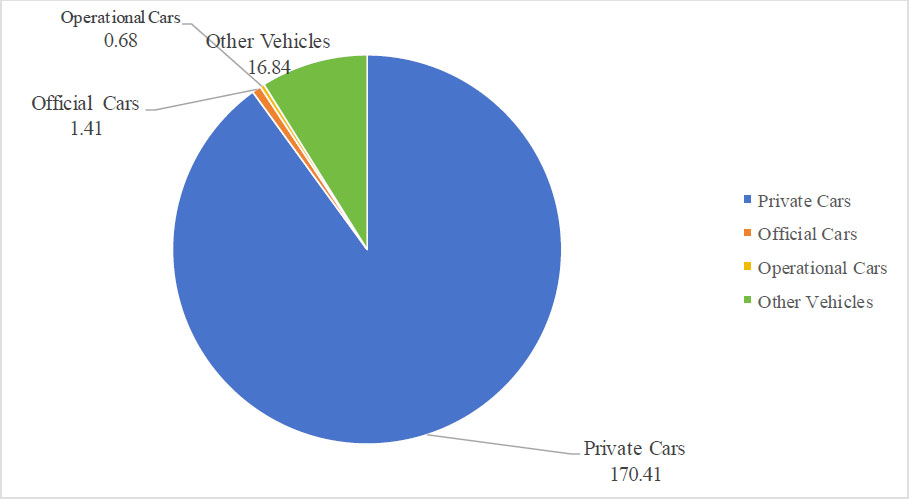
Number of e-vehicles of various types by target year in Nantong City (10^4).
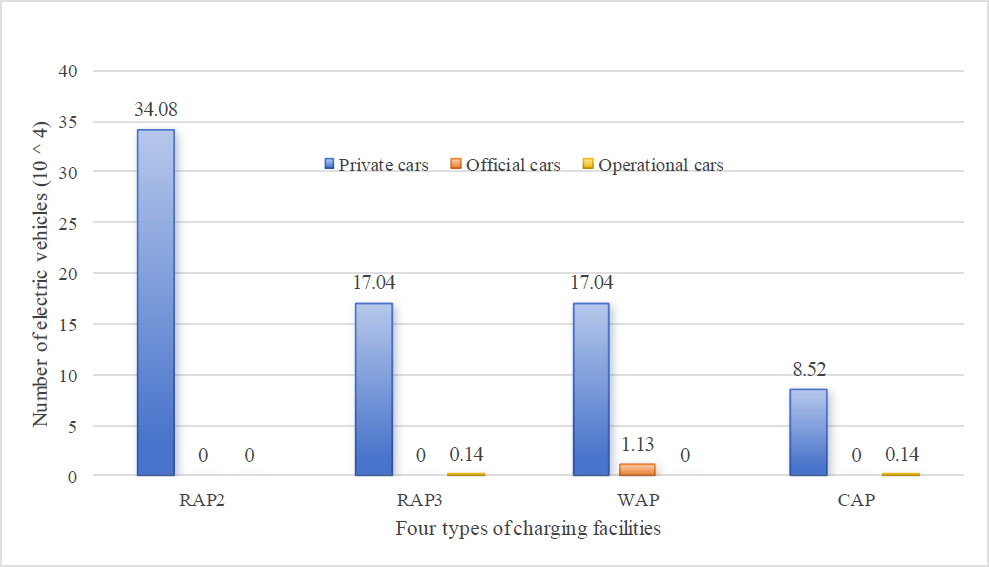
The number of charges for three types of electric vehicles on four charging facilities.
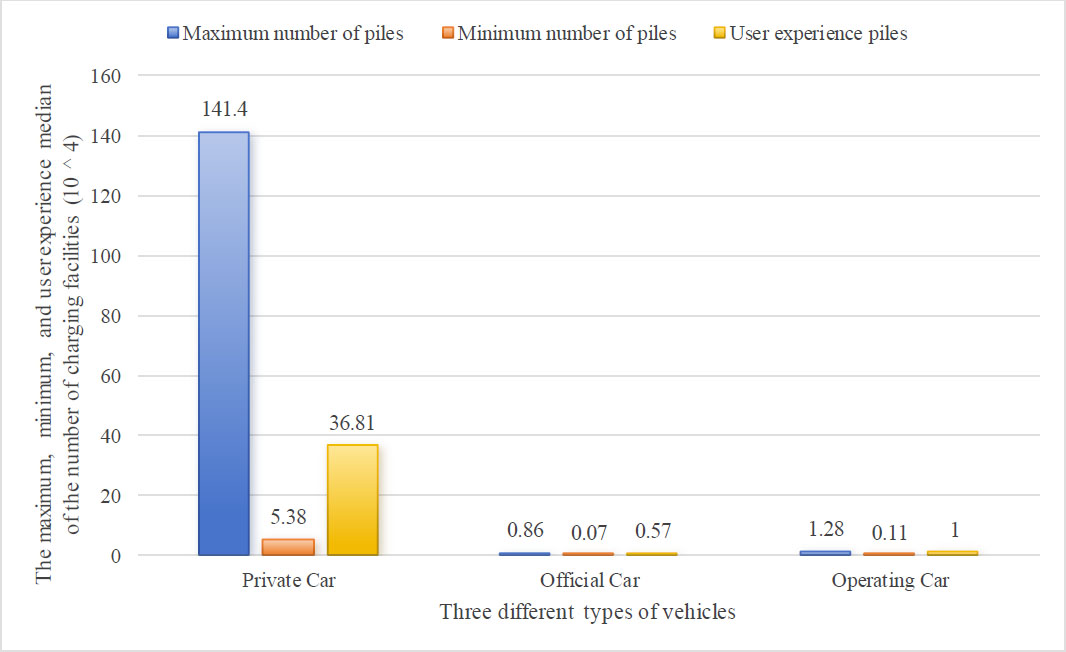
The maximum, minimum, and user experience median values for the number of charging facilities required for three types of cars.
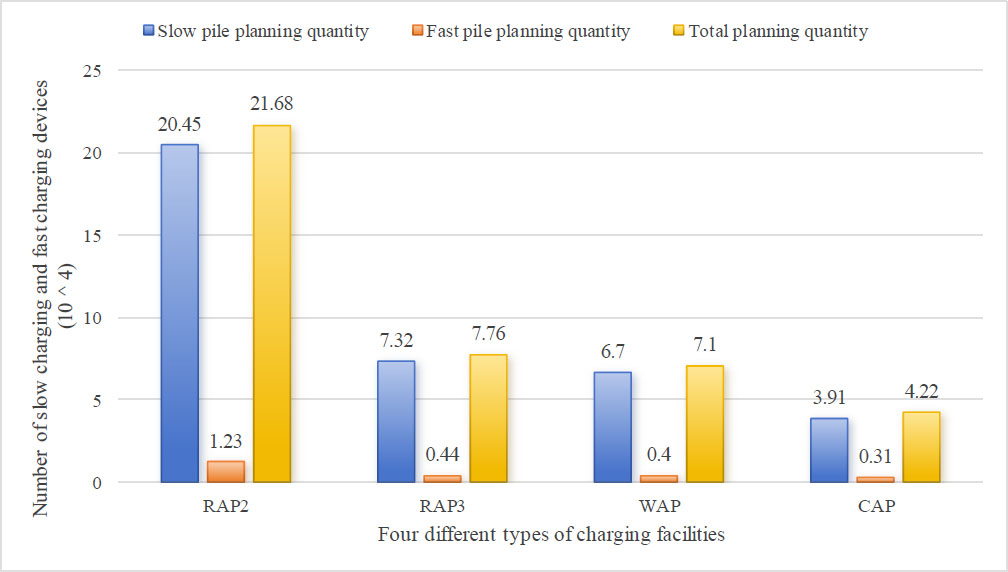
Number of slow and fast charging equipment planned for 4 different types of charging facilities by 2035.
4.3. Quantity Planning of Charging Stations in Various Areas of Nantong City's Planning Zone
In order to provide more practical guidance for the research results, this article selected Nantong Economic Development Zone as the research planning area for further refinement and research. The population of this area is about 346000 (accounting for 4.47% of the total population of Nantong), with an area of about 40 square kilometers (accounting for 0.5% of the total area) [37]. Figs. (11 and 12) show the population heat map and road network map, respectively. According to the population ratio, the number of charging stations required for each region can be calculated, as shown in Fig. (13) (the horizontal axis represents the charging demand points, corresponding to the numbers in Fig. (12).
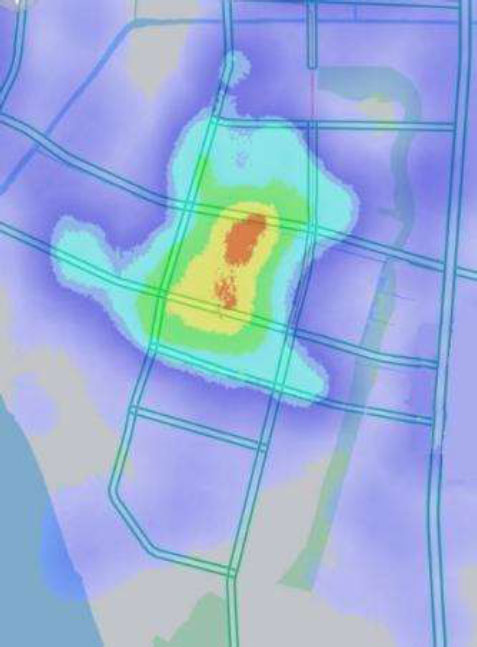
Population distribution heat map. Data source: Baidu Maps API.
5. DISCUSSION
5.1. Environmental Considerations
The popularization of electric vehicle charging stations has promoted a transformation in energy consumption in the transportation sector, shifting from traditional gasoline or diesel to cleaner electricity. This not only saves a lot of energy costs for the planning area of Nantong City but also reduces carbon emissions. In order to calculate the amount of gasoline consumed by fuel vehicles after the emergence of electric vehicles in the planning area, the number of electric vehicles in the planning area can be obtained based on the future number of electric vehicles and the population ratio of the planning area (4.47%). Combined with the market share of different types of vehicles and the fuel consumption of fuel vehicles per 100 kilometers (Table 3), the gasoline consumption of fuel vehicles from 2025 to 2035 was calculated. According to the widely recognized industry standard, fuel vehicles produce approximately 2.3 kilograms of carbon dioxide (CO2) emissions for every liter of gasoline consumed. It is possible to calculate the expected avoided CO2 emissions, as shown in Fig. (14).
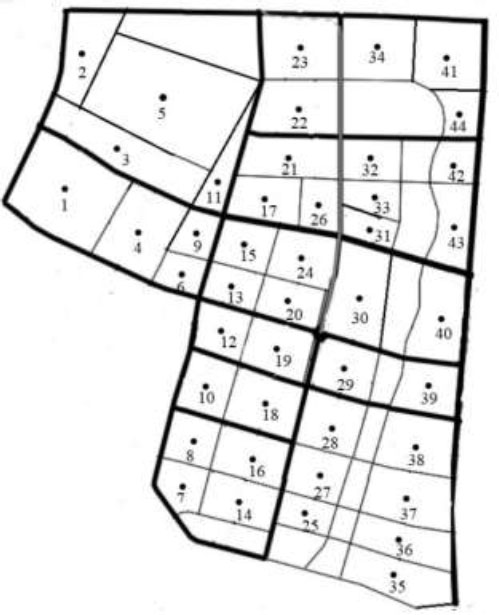
Simplified road network. Data source: Baidu Maps API.
| Types of Fuel Vehicles | Car Level | Proportion (%) | Fuel Consumption Per 100 Kilometers(L) | Average Fuel Consumption Per 100 Kilometers(L) |
|---|---|---|---|---|
| Private cars | A | 30 | 6 | 8.29 |
| B | 20 | 8 | ||
| C | 10 | 10.5 | ||
| SUV(A,B,C) | 40 | 9.6 | ||
| Official cars | C | 50 | 10.5 | 10.875 |
| SUV(B,C) | 50 | 11.25 | ||
| Operational cars | A | 80 | 6 | 6.4 |
| B | 20 | 8 |
5.2. Energy-renewable Management
If all electric vehicles and charging facilities are put into use as planned, based on current gasoline and electricity prices, using electric vehicles will result in significant cost savings compared to gasoline vehicles. Official data show that gasoline prices in China fluctuated between 6-8 RMB in 2023. For ease of calculation, the median value of 7RMB/L is taken. According to the survey, the average electricity price for commercial charging stations in the planned area of Nantong City in 2023 was 1.1 RMB/kWh. Based on the fuel consumption in Table 3 and the daily charging demand, a comparison chart of vehicle costs can be calculated, as shown in Fig. (15). All US dollars were calculated based on the current exchange rate of USD to RMB (1:7.11).
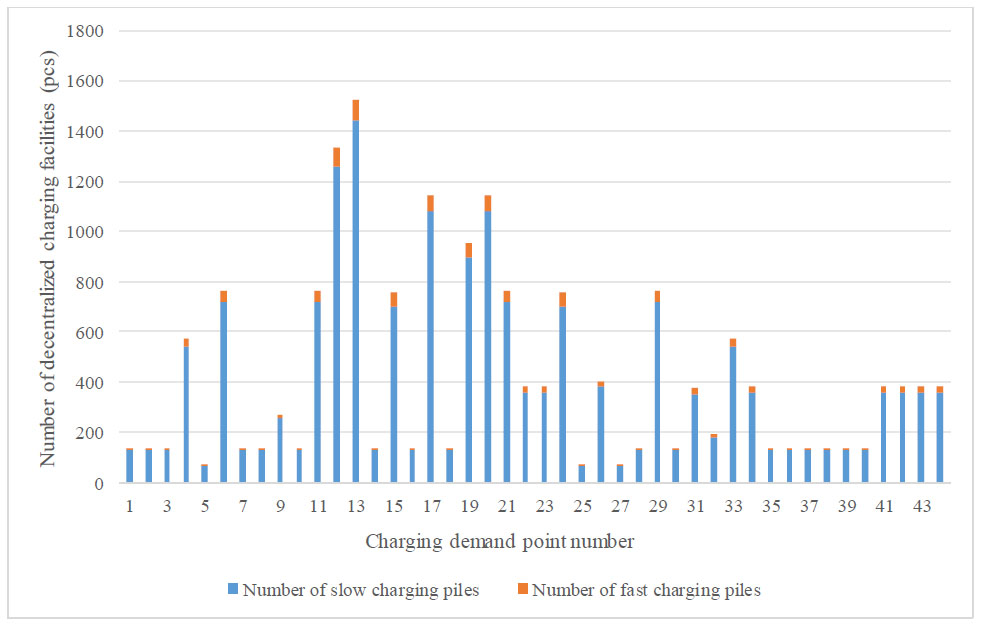
Map of the number of fast and slow charging facilities at each charging demand point.
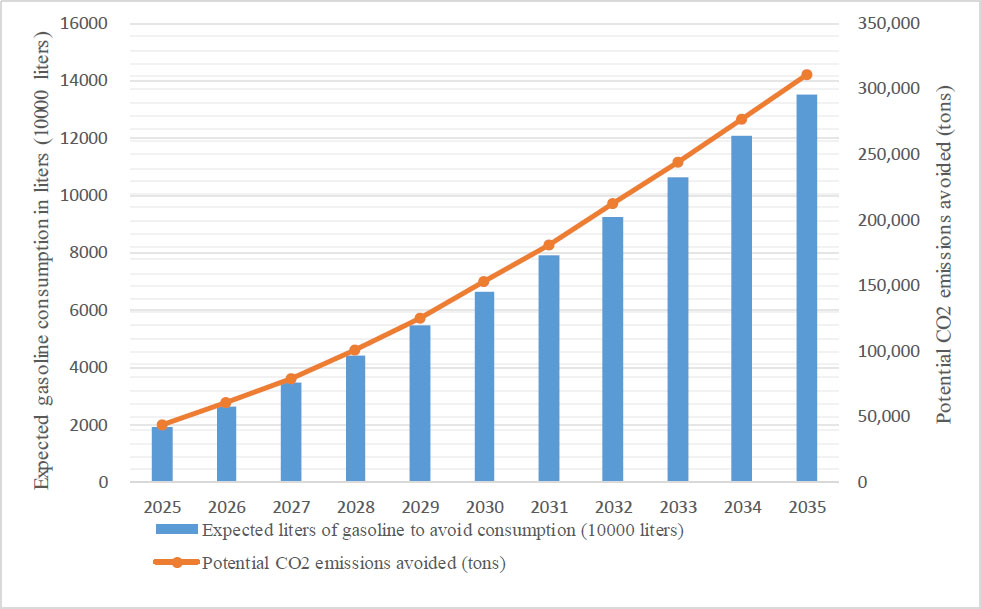
The expected avoided gasoline consumption and CO2 emissions.
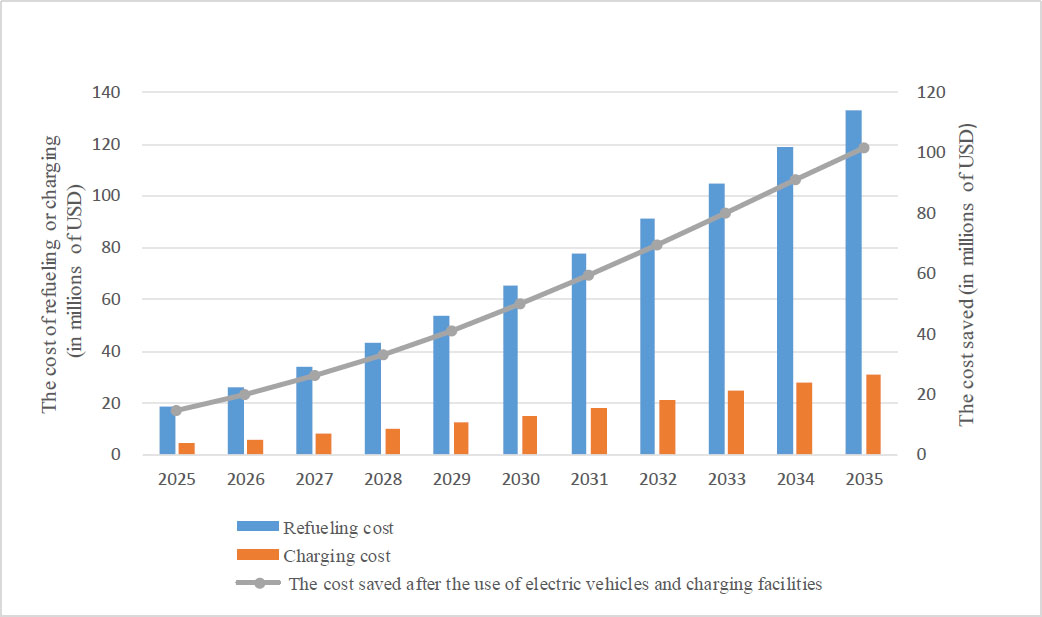
A Comparison of energy consumption costs between fuel vehicles and electric vehicles.
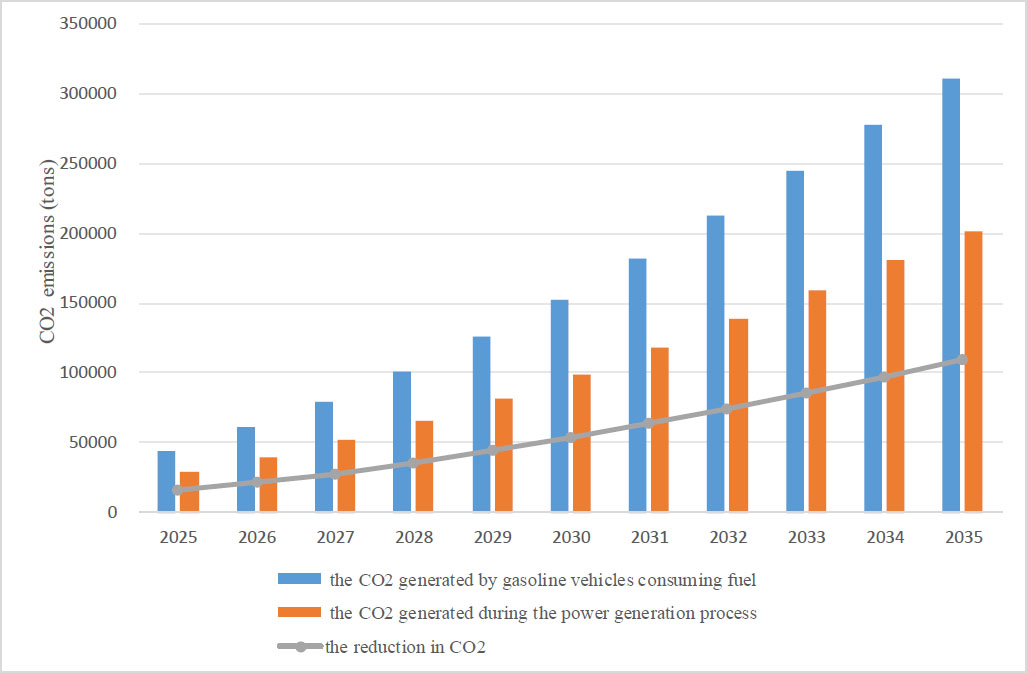
CO2 emission comparison.
In addition, there are several ways of generating electricity in the planning area, with coal power accounting for 70%. For every kilowatt hour of electricity generated by coal power, 0.96-1.1 kg of CO2 is produced. Here, we take the median value of 1 kg and assume that all-electric vehicle electricity comes from coal power generation and there is no loss in electricity transmission. Thus, the amount of CO2 generated during the power generation process can be obtained, and compared with the CO2 generated by gasoline vehicles consuming fuel, the reduction in CO2 caused by the use of electric vehicles and charging stations can be obtained, as shown in Fig. (16).
CONCLUSION
The layout of urban electric vehicle-decentralized charging facilities is a very important project, and the research in this article can provide a reference for relevant departments to build charging facilities in advance to meet the growing demand for charging. This article first predicts the number of electric vehicles in the planning area by 2035 based on car sales data. Then, according to the purpose of electric passenger vehicles, they are divided into three categories, and different types of vehicles are allocated to different types of charging facilities to calculate the charging demand on different charging facilities. Subsequently, the upper and lower limits of the decentralized charging facilities that should be built in the planning area by 2035, as well as the reasonable values for the good charging experience of basic users, were obtained for the basic charging demand. The planned number of slow piles in public piles was determined using the maximum and minimum value comparison method, and the corresponding planned number of fast piles was calculated based on the ratio of fast and slow piles in different functional areas, thus obtaining the total planned number of public piles and allocating it to each charging demand point, as shown in Fig. (13). It can be seen that by 2035, the planned area in Nantong City will need to build 18220 charging piles. Currently, there are only 2570 charging piles in the area, and there will be a 7-fold growth potential in the future, with huge development space. In addition, if all decentralized charging facilities can be put into operation as planned, it will bring huge economic and environmental benefits, save fuel consumption, reduce usage costs, and decrease CO2 emissions.
Due to constraints, such as basic data limitations, variability of urban infrastructure, behavioral factors related to electric vehicle charging, and uncertainty in the technological updates of electric vehicles and charging facilities, the results are inaccurate. Therefore, in order to obtain more stable and optimized methods, further research is needed in the future, such as testing models in other cities or integrating real-time data.
AUTHORS’ CONTRIBUTION
It is hereby acknowledged that all authors have accepted responsibility for the manuscript's content and consented to its submission. They have meticulously reviewed all results and unanimously approved the final version of the manuscript.
LIST OF ABBREVIATIONS
| EV | = Electric Vehicle |
| CO2 | = Carbon dioxide |
| RAP | = Residential Area Pile |
| WAP | = Work Area Public Pile |
| CAP | = Commercial Area Pile |
| FCS | = Fast Charging Station |
AVAILABILITY OF DATA AND MATERIALS
The data supporting the findings of the article is available in the [Zenodo] at [https://doi.org/10.5281/zenodo.15005444], reference number [DOI: 10.5281/zenodo.15005444
].
ACKNOWLEDGEMENTS
The authors would like to thank the reviewers for their efforts to improve this article.

