All published articles of this journal are available on ScienceDirect.

Traffic Characteristics Evaluation and Traffic Management Measures: A Case study of Dharwad City
Abstract
Traffic problems in the urban areas are increasing at a rapid rate. Engineers, planners or the policymakers are having a tough time in dealing with their multiple constraints for getting the desired solution. Some of the main transportation planning problems are mixed traffic plying on the roads, inadequate parking areas, increasing number of vehicles and road users, the unbalanced pattern of land use with obsolete road system, increasing number of road facilities and environmental pollution. Since in India most of the cities are unplanned, we are only left with an option management of existing infrastructure. In this paper, one such case study is presented in which a detailed traffic management for the city of Dharwad is carried out.
1. INTRODUCTION
The population of India which is growing at a tremendous rate coupled with the growing cities has resulted in the increased individual distance travelled for their daily commuting. Also, the lack of public transportation forced the increase in private mode for travel needs to result in an increase in privately owned vehicles. Unfortunately, the road development has not kept in pace with the increased traffic. The total road length in India is around 5.47 million kilometres (as in 2015) against 0.39 million in 1951 [1]. As per the Basic road statistics of India, the number of registered motor vehicles has grown at a CAGR of 10.6 percent between 1951 and 2011, while the growth in the road network during the same period was 4.2 percent [2]. Table 1 shows the Percentage vehicular growth versus road length growth.
| Period | Percentage Vehicular Growth | Percentage Road Length Growth |
|---|---|---|
| 1951-1961 | 8.1 | 2.7 |
| 1961-1971 | 10.9 | 5.7 |
| 1971-1981 | 11.2 | 5 |
| 1981-1991 | 14.8 | 4.6 |
| 1991-2001 | 9.9 | 3.8 |
| 2001-2011 | 9.9 | 3.4 |
| 1951-2011 | 10.6 | 4.2 |
Traffic management is the process of utilising the existing infrastructure to maximise the effectiveness of the system in order to ensure safe and reliable operation of traffic. Most of the Indian cities are unplanned and due to the catastrophic increase in the vehicle growth, it is very essential for transport planners to manage the traffic with the existing infrastructure with minimum cost.
The wide variety of traffic units with their great disparity in size and speed creates a number of problems viz., delay, congestion, accidents and areas of conflicts. Due to the mixing up of different classes of vehicles, the journey speed is considerably reduced and the capacity of the roads is adversely affected and severe congestion has been found to be occurring frequently in the CBD area. Constants stoppages, acceleration and deceleration and movement in low gears increase operational costs and wear and tear of vehicles. The conflicts, confusion and irritation caused by mixed traffic result in accidents.
Studies were carried out to calculate the traffic conditions in speeds at midblock, space mean speed and time mean speed and the delays for a particular stretch [3, 4]. Studies on speed and delays were used to calculate the delays and further find the relationship between speeds of different types of vehicles [5]. Volume counts at intersections and on mid-block help to evaluate the level of service at which the section of road is under operation [6].
Traffic management involves monitoring the actual traffic situation (speed and volume counts) and controlling the flow in order to ease the traffic movement without congestion and to increase the safety of the road users. Traffic management involves signals re/designing, speed studies, parking and pedestrian studies. In this paper, a detailed traffic study with existing and proposed measures is presented for the city of Dharwad.
2. STUDY AREA
Dharwad is situated on the edge of Western Ghats and hence is a hilly town. Spread over seven small hills at an average altitude of 750 meters above sea level, the city enjoys a 14 salubrious climate amidst thick vegetation, with coordinates of 15°27′N 75°00′E15.45°N 75.0°E. Dharwad along with Hubli is major cities of Karnataka with a population of 943,788 as per 2011 census and it is estimated to be more than I million now. Hubli is situated at a distance of 20 km from Dharwad.
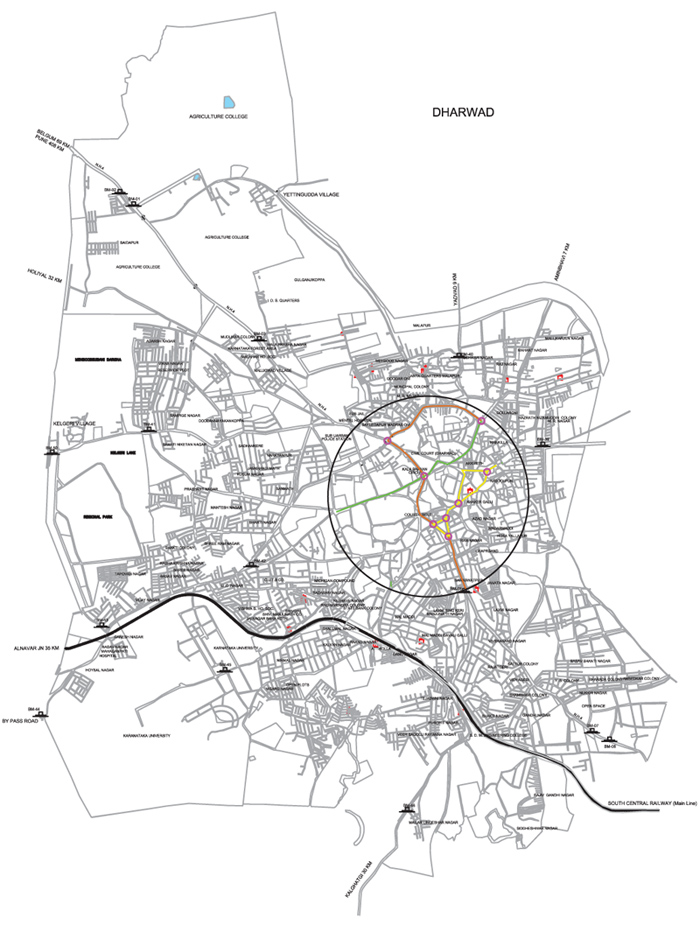
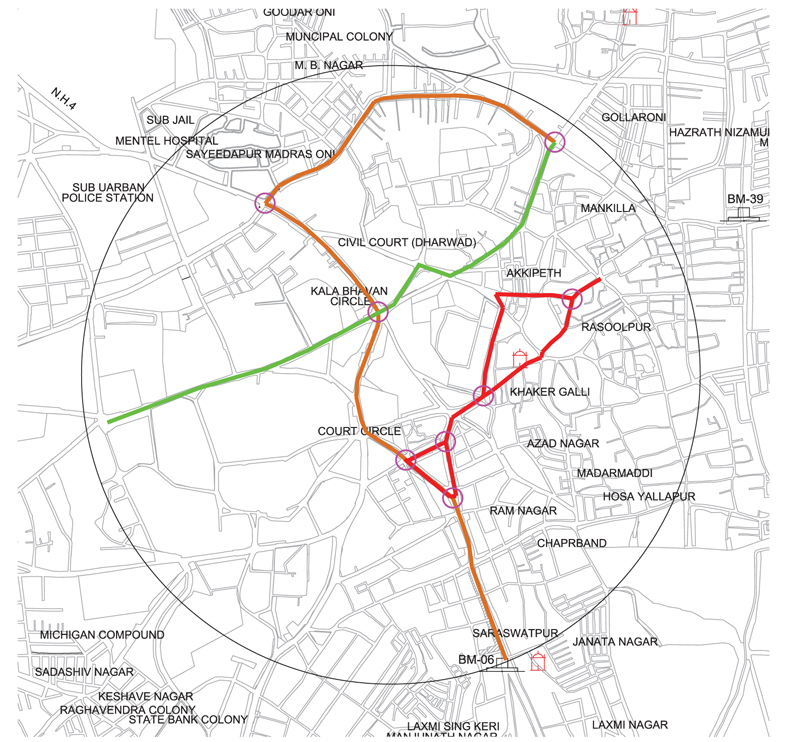
Indian cities are developed as a radial pattern. The city has a Central Business District (CBD) and the surrounding residential and community utilities. The major traffic problem occurs in the CBD area. The study area is selected which has a major traffic problem. So to carry out the traffic management study, we have taken the study area starting from the entrance of Dharwad city i.e. from Toll Naka intersection in the east to the DHO (Old DSP) office junction in the west and Shivaji circle in the north to KCD circle in the south, covering all major intersections and the CBD area. Fig. (1) shows the road network of Dharwad City, the area under the circle is considered for the study.
3. METHODOLOGY
The objective of this study is to obtain the traffic characteristics like spot speed, Speed and delay of the particular stretch road and the volume counts at the intersections of Dharwad city. The data is used to determine the level of service, amount of congestion and the measures that need to be taken in order to ease the situation.
3.1. Spot Speed Study
For the spot speed study, the spot watch method is used. This is one of the simplest methods for spot speed determination. Two reference points are marked on the pavement at a suitable distance apart and an observer starts and stops watch as a vehicle crosses these two marks. From the known distance and the measured time intervals speed are calculated. But this is the least accurate method, therefore in order to check the accuracy of the measure few samples are collected using radar meter. A classified count was conducted between 9.00AM to 12.00PM and 4.PM to 7.00PM on working day.
The spot data is used to calculate the average speed of traffic stream and the safe speed on the stretch. The 50th percentile speed refers to the average speed and the 85th percentile speed refers to the safe speed. The frequency distribution table is the convenient method to find the percentile speed.
3.2. Speed and Delay Study
To carry out the speed and delay study, the most convenient method is the Moving car method. In this method, the speed and flow can be obtained by travelling in a car against and with the flow and noting down the journey times, delays, the number of vehicles met with from the opposite direction, a number of vehicles overtaking the test vehicle and number of vehicles overtaken by the test vehicle.
- To conduct a Travel Time and Delay Study, one must first define the study area by selecting all control points before beginning the study. The time periods recommended for studies are A.M. and P.M. peak hours as well as off-peak hours in the direction of heaviest traffic movements. An average of six round ensures the accuracy in the results [7].
- These studies should be made during reasonably good weather so that unusual conditions do not influence the study, such as crashes or other unusual delays will produce erroneous results, any runs made during such an occurrence should be terminated and another run conducted. These studies should be conducted during average or typical weekday traffic conditions.
Keeping in view of the above things, the study was conducted in morning peak from 9.00am to 11.00am, evening peak from 5.00pm to 7.00pm and off-peak from 1.00pm to 3.00 pm. The collected will be used to know the running speed and the journey speed of the different corridors. The details of the data and the analysis are given in the next section.
3.3. Traffic Volume Counts for the Design of Road Junctions
For the requirement of road design, it is necessary to know the directional movement of traffic in peak hour. The survey is conducted using stationary enumerators at each arm of the junction to note down the vehicles entering and direction of the exit. Mechanical counters are used to note down the different categories of vehicles. It is sufficient to note down two hours of morning and evening peak [7]. But in order to get the exact peak hour, we took 4 hours in the morning from 8.00am to 12.00pm and evening 4.00pm to 8.00pm to analyze the existing turning movement pattern and to plan the required improvements at the junctions.
The main objective of traffic volume counts is to evaluate the Level Of Service (LOS) at the intersection and at midblock. LOS represents the ease at which the traffic is moving at that particular point. In order to evaluate the LOS, the following data was collected; design hour turning movement volume, vehicle classification for design hour, peak hour factor, prevailing speed, number of lanes on major and minor streets, type of control on minor streets and other geometries of the intersections.
4. DATA AND ANALYSIS
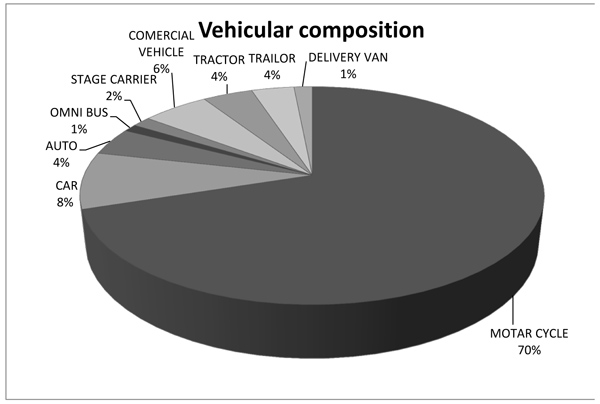
Dharwad city traffic has heterogeneous traffic with a mixture of fast-moving motor traffic and slow moving traffic. Even extremely slow traffic such as animal-drawn vehicles can be seen on the roads of Dharwad. Motor traffic consists mainly of a two-wheeler, cars and commercial vehicles. Pedestrian traffic is found to be very heavy in the CBD areas of the city. Fig. (2) shows the traffic composition of Dharwad.
4.1. Spot Speed Study
Three roads were selected to carry out the speed studies, Old PB road, Dandeli road and Saudathi road. These three road pass through the centre of the city and intersect at the Jubilee Circle. Seven locations selected on these three roads are as below along with average spot speeds. L1 and L2 are on Old PB road, L2 and L4 are on Dandeli road, L5, L6 and L7 are on Saudathi road.
L1- Between Jubilee Circle and DHO Circle
L2- Between Jubilee Circle and Court Circle
L3- Dandeli road near KCD
L4- Dandeli road near Jubilee Circle
L5- In front of Corporation office
L6- In front of Azad Park
L7- Between Corporation Circle And CBT circle
| Vehicle type | SPEEDS IN kmph | ||||||
|---|---|---|---|---|---|---|---|
| L1 | L2 | L3 | L4 | L5 | L6 | L7 | |
| Two wheeler | 34 | 31 | 34 | 36 | 29 | 26 | 28 |
| Auto | 28 | 27 | 27 | 31 | 24 | 24 | 23 |
| Car | 33 | 30 | 36 | 35 | 26 | 24 | 26 |
| Bus | 30 | 29 | 31 | 31 | 24 | 22 | 24 |
| Truck | 29 | 27 | - | - | - | - | - |
The average speed of vehicles on Old PB road towards Belgaum is found to be 31 kmph, towards Bangalore, it is found to be 29 kmph. The speed average speed measured on Dandeli road is 32 kmph, and on Saudathi, road is around 25 kmph. On all the roads, it is observed that speeds of two-wheeler and cars are high, in the range of 30-40kmph. Whereas auto, buses and truck speed is in the range of 25-30 kmph.
The speed of more than 500 vehicles in each direction was found and the tally sheet for the same is given in Tables 3 and 4 represents the frequency distribution table for the three routes are calculated separately to calculate the 15th, 50th, 85th and 90th percentile speed.
| Speed in kmph | Two-Wheeler | Auto | Car | Bus | Truck | ||||||||||
|---|---|---|---|---|---|---|---|---|---|---|---|---|---|---|---|
| Old PB Road | Dandeli Road | Saudathi Road | Old PB Road | Dandeli Road | Saudathi Road | Old PB Road | Dandeli Road | Saudathi Road | Old PB Road | Dandeli Road | Saudathi Road | Old PB Road | Dandeli Road | Saudathi Road | |
| 10--19.9 | 2 | 5 | 9 | 2 | 20 | 22 | 1 | 2 | 14 | 0 | 3 | 29 | 4 | 0 | 0 |
| 20--29.9 | 56 | 34 | 82 | 87 | 67 | 88 | 54 | 32 | 83 | 67 | 65 | 83 | 49 | 0 | 0 |
| 30--39.9 | 80 | 81 | 28 | 29 | 62 | 7 | 57 | 86 | 22 | 51 | 81 | 8 | 27 | 0 | 0 |
| 40--49.9 | 20 | 34 | 1 | 0 | 10 | 0 | 7 | 33 | 1 | 2 | 10 | 0 | 0 | 0 | 0 |
| 50--59.9 | 2 | 2 | 0 | 0 | 1 | 0 | 1 | 3 | 0 | 0 | 1 | 0 | 0 | 0 | 0 |
| 60--69.9 | 0 | 2 | 0 | 0 | 0 | 0 | 0 | 2 | 0 | 0 | 0 | 0 | 0 | 0 | 0 |
| Speed Class (kmph) | Median | Class Frequency (fi) | fivi= i*fi | Percentage of Observation in Class | Cumulative Percentage Observation | - |
|---|---|---|---|---|---|---|
| For Route 1 (Old PB Road) | - | |||||
| 15-19.9 | 17.5 | 10 | 175.0 | 1.67 | 1.67 | - |
| 20-24.9 | 22.5 | 80 | 1800.0 | 13.33 | 15.00 |  |
| 25-29.9 | 27.5 | 234 | 6435.0 | 39.00 | 54.00 | |
| 30-34.9 | 32.5 | 188 | 6110.0 | 31.33 | 85.33 | - |
| 35-39.9 | 37.5 | 56 | 2100.0 | 9.33 | 94.67 | - |
| 40-44.9 | 42.5 | 19 | 807.5 | 3.17 | 97.83 | - |
| 45-49.9 | 47.5 | 10 | 475.0 | 1.67 | 99.50 | - |
| 50-54.9 | 52.5 | 2 | 105.0 | 0.33 | 99.83 | - |
| 55-59.9 | 57.5 | 1 | 57.5 | 0.17 | 100.00 | - |
| Total | 600.000 | - | ||||
| For Route 2 (Dandeli Road) | - | |||||
| 10-14.9 | 12.5 | 1 | 12.5 | 0.156 | 0.156 | - |
| 15-19.9 | 17.5 | 29 | 507.5 | 4.531 | 4.688 | - |
| 20-24.9 | 22.5 | 68 | 1530.0 | 10.625 | 15.313 |  |
| 25-29.9 | 27.5 | 134 | 3685.0 | 20.938 | 36.250 | |
| 30-34.9 | 32.5 | 177 | 5752.5 | 27.656 | 63.906 | |
| 35-39.9 | 37.5 | 133 | 4987.5 | 20.781 | 84.688 | - |
| 40-44.9 | 42.5 | 56 | 2380.0 | 8.750 | 93.438 | |
| 45-49.9 | 47.5 | 31 | 1472.5 | 4.844 | 98.281 | - |
| 50-54.9 | 52.5 | 4 | 210.0 | 0.625 | 98.906 | - |
| 55-59.9 | 57.5 | 3 | 172.5 | 0.469 | 99.375 | - |
| 60-64.9 | 62.5 | 3 | 187.5 | 0.469 | 99.844 | - |
| 65-69.9 | 67.5 | 1 | 67.5 | 0.156 | 100.000 | - |
| Total | 640.000 | - | ||||
| For Route 3 (Saudathi Road) | - | |||||
| 10-14.9 | 12.5 | 10 | 125.0 | 2.083 | 2.083 | - |
| 15-19.9 | 17.5 | 67 | 1172.5 | 13.958 | 16.042 | |
| 20-24.9 | 22.5 | 170 | 3825.0 | 35.417 | 51.458 | |
| 25-29.9 | 27.5 | 166 | 4565.0 | 34.583 | 86.042 | - |
| 30-34.9 | 32.5 | 51 | 1657.5 | 10.625 | 96.667 | - |
| 35-39.9 | 37.5 | 14 | 525.0 | 2.917 | 99.583 | - |
| 40-44.9 | 42.5 | 1 | 42.5 | 0.208 | 99.792 |  |
| 45-49.9 | 47.5 | 2 | 47.5 | 0.208 | 100.000 | - |
| Total | 480 | - | ||||
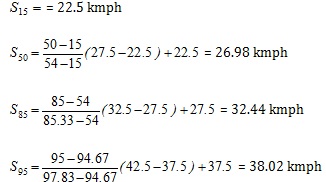
As it can be observed from Table 4 the exact 15th, 50th, 85th and 95th percentile speed is not found. Therefore the following method is used to calculate the exact speeds.
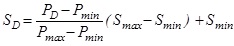 |
Where:
SD= Speed at PD, PD= percentile desired, Pmax = higher cumulative percent, Pmin = lower cumulative percent, Smax = higher speed and Smin = higher speed
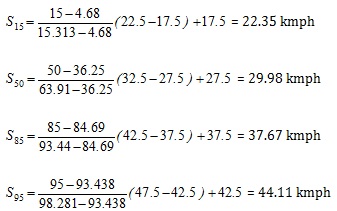
Therefore, the exact 15th, 50th, 85th and 95th percentile speed for the three routes are as follows,
For Route 1:
 |
For Route 2:
 |
For Route 3:
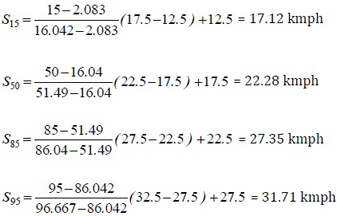 |
15th percentile speed is the lower speed limit at which the vehicle can move, 50th percentile speed is the average speed of the traffic stream, 85th percentile speed is the safe speed and 95th percentile speed is the design speed for the road section.
The average speed for the first route is around 27 kmph and the safe speed found to be 32.44 kmph. For the second route, the average speed is 30kmph and the design speed is 37.67 kmph. The first route is the old PB road which has a relatively higher volume compared to Dandeli road in route 2 as seen from the results.
Similarly, the third route passes through the CBD, and the average speed and the safe speed will much lower than the other two roads i.e. 22.28 kmph and 27.35 kmph, respectively.
4.2. Speed And Delay Study
Journey time studies on a road network in a town are used to evaluate congestion, capacity, level of service and need for improvements. The study was conducted using a moving car technique. Three routes were selected which include all major roads connected to the city i.e. Old PB road, Dandeli road and Saudathi road. The study also covers the CBD area of the city. Route 1 starts from Toll Naka to Shivaji Circle Vis DHO circle, Route 2 starts from KCD circle to Shivaji circle via Kalabhavan circle and Route 3 covers the market area, i.e. from Lakshmi theatre to NTTF via Hanuman temple and Gandhi Chowk. The three routes are shown in Figure 3. The survey data has been analysed to obtain.
- Journey time and journey speed
- Duration, location and cause for delay.
- Running time and running speed.
The results of the study are given in Table 5. The study reveals that the on the major corridor, the delay was at junctions and due to bus stops, and on CBD area, the delay was due to congestion, pedestrian movements and bus stand. The maximum running speed of 31 kmph is observed between Jubilee circle and DHO junction and the minimum of 11 kmph between Gandhi Chowk and CBT circle. On the main road, the average overall journey speed is around 21 kmph, and on CBD area, the speed is around 15 kmph, which means that these two corridors are approaching unstable flow, with tolerable delay i.e. the level of service is D.
| NAME OF THE SECTION | AVERAGE JOURNEY SPEED (km/h) | AVERAGE RUNNING SPEED (km/h) | REASONS FOR DELAYS | ||||||||||
|---|---|---|---|---|---|---|---|---|---|---|---|---|---|
| Off-peak | Morning Peak | Evening Peak | Off-peak | Morning Peak | Evening Peak | ||||||||
| UP | DOWN | UP | DOWN | UP | DOWN | UP | DOWN | UP | DOWN | UP | DOWN | ||
| ROUTE NO:1 | |||||||||||||
| Toll naka-Lakshmi theatre | 24 | 23 | 22 | 19 | 19 | 18 | 26 | 26 | 24 | 21 | 22 | 20 | Intersection |
| Lakshmi treatre-Jubilee circle | 20 | 18 | 20 | 21 | 19 | 17 | 23 | 21 | 20 | 22 | 21 | 20 | Intersection |
| Jubilee circle-DHO office | 26 | 25 | 19 | 21 | 29 | 28 | 30 | 30 | 20 | 25 | 31 | 29 | Intersection |
| DHO office- Shivaji circle | 17 | 14 | 15 | 16 | 18 | 15 | 17 | 17 | 15 | 16 | 18 | 18 | Intesection & congestion |
| ROUTE NO:2 | |||||||||||||
| KCD circle-Jubilee circle | 24 | 23 | 22 | 21 | 24 | 23 | 24 | 22 | 22 | 21 | 23 | 22 | |
| Jubilee circle-Regal Theatre | 18 | 17 | 18 | 18 | 16 | 15 | 15 | 15 | 16 | 16 | 13 | 13 | Intesection & congestion |
| Regal theatre-Shivaji circle | 13 | 16 | 18 | 15 | 15 | 17 | 14 | 17 | 18 | 15 | 15 | 17 | congestion |
| ROUTE NO:3 | |||||||||||||
| Lakshmi theatre- Bosappa circle | 21 | 21 | 18 | 17 | 15 | 16 | 21 | 21 | 18 | 19 | 16 | 16 | |
| Bosappa circle-Gandhi Circle | 18 | 24 | 17 | 15 | 13 | 14 | 19 | 24 | 17 | 15 | 13 | 17 | congestion |
| Gandhi cicle-CBT Circle | 11 | 19 | 11 | 13 | 11 | 10 | 12 | 20 | 15 | 14 | 11 | 11 | congestion |
| CBT Circle- Hanuman Temple | 16 | 14 | 10 | 13 | 13 | 15 | 16 | 14 | 14 | 15 | 14 | 15 | |
| Hanuman Temple-NTTF | 21 | 21 | 18 | 18 | 18 | 19 | 23 | 21 | 19 | 18 | 18 | 19 | congestion |
| NTTF-Lakshmi theatre | 23 | 21 | 21 | 20 | 18 | 22 | 23 | 21 | 21 | 21 | 19 | 22 | |
The following are the main reasons for greater travel time:
- On main roads, the delays are due to the intersections.
- Pedestrians using the carriageway for movement since there are no proper footpaths.
- Unscientific location of bus stops causing the blockage of narrow carriageways.
- Presence of crossroads connecting mainstream causing congestion.
- In the CBD area, the CBT bus stand and old bus stand causes long delays.
4.3. Volume Counts
Classified traffic volume counts are carried out to know traffic characteristics, directional split and hourly variation. A traffic volume count indirectly indicates the capacity utilization. If the traffic is heavy, the road suffers from congestion with consequent loss in journey speeds. Lower speed cause economic loss to the community due to time lost by the occupants of volume counts are, therefore, indicators of the need to improve the transport facilities and is an invaluable tool in the hands of transport planner. A classified count was conducted from 8.00AM to 12.00PM and 4.PM to 8.00PM on working day.
Urban roads are characterized by mixed traffic conditions resulting in complex interaction between various kinds of vehicles. To cater to this, it is usual to express the capacity of urban roads in terms of a common unit. The unit generally employed is the Passenger Car Unit (PCU). PCU values are adopted for different classes of vehicles depending open the percentage of vehicle category as per IRC 106-1990 [8].
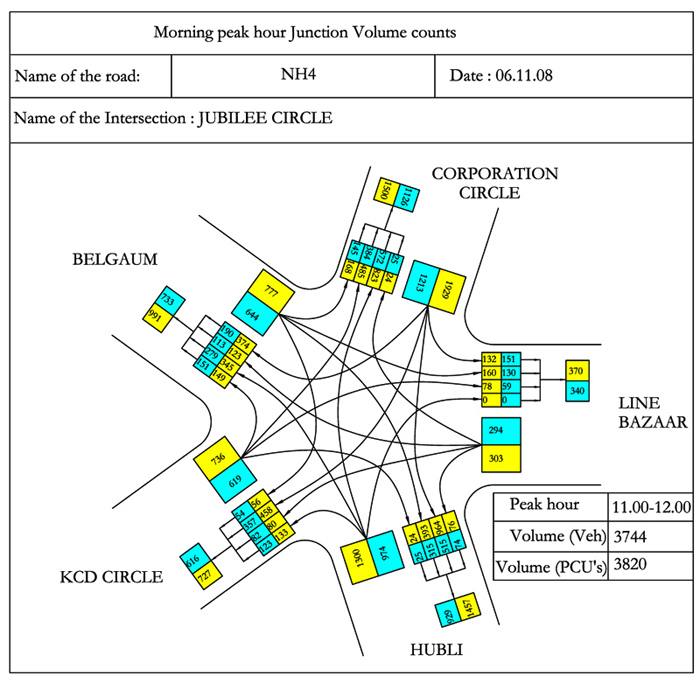
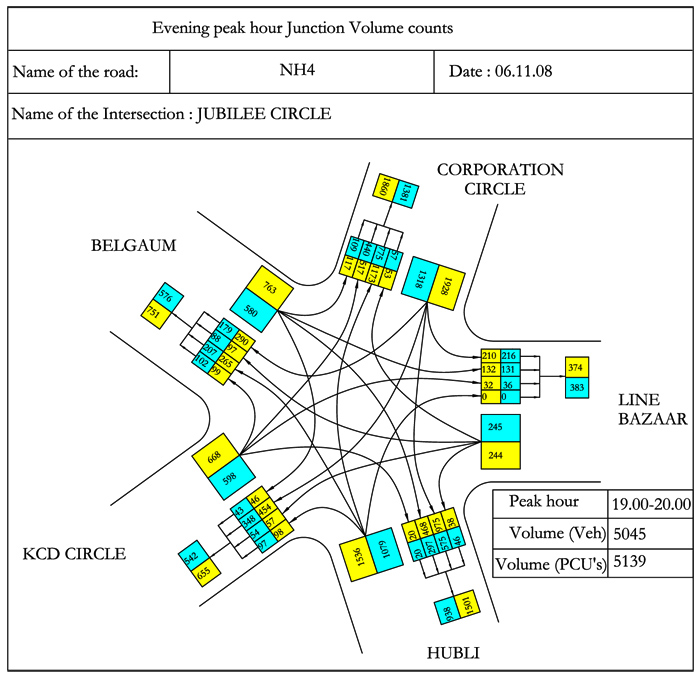
Eleven major intersections were selected for the study. The intersections were chosen based on the study area. These intersections lie on the three roads that pass through the city. The peak hour tuning movement for one of the major junction is given in Fig. (4A and B). The consolidated peak hour volume for all the intersections was obtained and is presented in (Table 6).
| Name of the Intersection | Morning | Evening | ||
|---|---|---|---|---|
| Peak Hour | volume | Peak Hour | Volume | |
| Toll Naka | 10.15-11.15 | 3163 | 17.30-18.30 | 2966 |
| Bagalkot petrol pump | 10.45-11.45 | 3307 | 18.15-19.15 | 3959 |
| NTTF | 10.45-11.45 | 3460 | 18.45-19.45 | 3929 |
| Lakshmi theatre | 10.15-11.15 | 3402 | 18.45-19.45 | 3668 |
| Court circle | 10.45-11.45 | 3845 | 18.45-19.45 | 4152 |
| Jubilee circle/ Kalabhavan circle | 11.00-12.00 | 5045 | 19.00-20.00 | 5139 |
| DHO circle | 10.45-11.45 | 3026 | 17.45-18.45 | 2876 |
| CBT circle | 10.30-11.30 | 4443 | 18.30-19.30 | 4275 |
| Shivaji circle | 10.15-11.15 | 1922 | 18.00-19.00 | 1904 |
| KCD circle | 10.30-11.30 | 1800 | 17.30-18.30 | 1974 |
| Shiva sagar hotel | 11.00-12.00 | 1968 | 19.00-20.00 | 3218 |
4.3.1. Level of Service
The main objective of traffic volume counts is to calculate the level of service for that intersection. Level of service is defined as a qualitative measure describing operational conditions within a traffic stream and their perception by drivers/passengers. Level of service definition generally describes these conditions in terms of factors such as speed and travel time, freedom of maneuver, traffic interruption, comfort, convenience and safety. The level of service of an intersection is determined using IRC SP-41 [9]. The data was obtained in 2008, keeping the design period as 10 years, the volume count was extrapolated with a growth rate of 9% which is obtained by the local road transport authority.
Similarly, the LOS for the midblock is calculated for different legs of the intersection. For the intersections, the LOS is based on the reserve capacity and it shows the expected delay to minor street traffic, whereas for the mid-block, LOS is based on the volume to capacity (V/C) ratio. i.e. the LOS for the minor roads at intersections may be F, which means Stop and Proceed, which is true whereas the LOS based on V/C ratio for the same leg at mid-block is comparatively good which shows that the volume is less than the capacity.
The analysis is carried out to evaluate the LOS for all the intersections both at midblock and at the intersection. The analysis is done for present and the design period and is given in (Table 7).
| S NO. | NAME OF THE INTERSECTION | NAME OF THE LEG | 2008 | 2018 | |||
|---|---|---|---|---|---|---|---|
| At Intersection | At midblock | At Intersection | At midblock | ||||
| 1 | TOLL NAKA | Dharwad | E | F | F | F | |
| Hubli | E | F | F | F | |||
| Bypass | F | B | F | F | |||
| 2 | BAGALKOT PETROL PUMP JUNCTION | Dharwad | D | F | E | F | |
| Hubli | B | F | E | F | |||
| Malmaddi | F | B | F | F | |||
| Hosayellapur | F | A | F | A | |||
| 3 | NTTF JUNCTION | Jubilee circle | E | F | F | F | |
| Hubli | E | F | F | F | |||
| Line bazaar | F | E | F | F | |||
| 4 | LAKSHMI THEATRE JUNCTION | Jubilee circle | C | F | D | F | |
| Hubli | A | F | A | F | |||
| Taluk office | F | B | F | F | |||
| Line bazaar | F | A | F | E | |||
| 5 | COURT JUNCTION | Jubilee circle | A | F | D | F | |
| Hubli | D | F | F | F | |||
| Railway Station | F | A | F | B | |||
| Line bazaar | E | A | E | A | |||
| DC Compound | A | A | A | A | |||
| 6 | KALABHAVAN (JUBILEE) JUNCTION | Belgaum road | A | C | F | F | |
| Hubli road | A | F | B | F | |||
| KCD | F | A | F | B | |||
| Line bazaar | F | A | F | C | |||
| CBT Circle | F | B | F | F | |||
| 7 | DHO (OLD DSP) OFFICE JUNCTION | Belgaum | C | D | F | F | |
| Hubli | D | F | F | F | |||
| KCD | E | D | F | F | |||
| Shivaji circle | F | C | F | F | |||
| 8 | CBT CIRCLE | Jubilee circle | A | D | B | F | |
| Corporation office | F | D | F | F | |||
| Shivaji circle | A | F | A | F | |||
| Vivekananda circle | F | F | F | F | |||
| 9 | KCD CIRCLE | Jubilee circle | B | A | C | D | |
| KCD | A | A | B | A | |||
| AIR | A | A | B | C | |||
| Dasankoppa | A | B | B | F | |||
| KUD | A | A | B | F | |||
| 10 | SHIVAJI CIRCLE | DHO Office | F | A | F | D | |
| Regal theatre | A | D | A | F | |||
| Soudhatti | A | B | C | F | |||
| Navalgunda | C | A | F | A | |||
| 11 | SHIVA SAGAR JUNCTION | Tikare road | C | F | F | F | |
| Subhas road | E | F | F | F | |||
| Jakkanbhavi | F | F | F | F | |||
| Bus stand | F | F | F | F | |||
In order to have free movement of the vehicle, the maximum allowable LOS is C, anything above this will result in the decreased capacity. From Table 7, it can be noted that for the design period, one intersection (KCD) has the LOS B and C for all the legs. Therefore, in order to have desired LOS, some of the traffic management measures were proposed as per IRC SP: 43-1994 [10].
4.3.2. Junction Improvements
Intersections are to be redesigned to cater to the present day and future traffic and pedestrian volume. Channelising island has to be included to reduce the area of possible conflicts between traffic streams. Establish the desired angle of crossing and merging and serve as pedestrian refuges. The intersections are to be designed considering appropriate turning radius, adequate lanes, appropriate road markings and signboards.
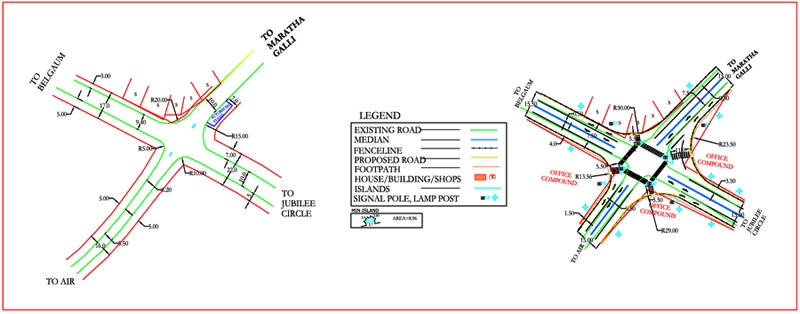
The geometric of all eleven intersections were redesigned by providing necessary elements such as proper median, channelising islands, turning radius, etc, as per IRC SP:41-1994 [9]. Along with this, some of the major roads are proposed for widening from existing two lanes to four lanes. Figs. (5A and B) show the geometries of the junction (DHO) before and after the proposed improvements. As a result, the Shivaji, KCD, CBT and Lakshmi Theater junctions have reached the required LOS. Further, in order to bring all the intersection to the desired LOS, some of the restrictions are proposed.
4.3.3. Traffic Management Techniques
Restriction of long route buses from entering old bus stand
There is a bus stand at the centre of CBD area in the city of Dharwad. Buses including Hubli-Dharwad intercity services, Mofussil services and also intracity services of Dharwad visit this bus stand. As a result, the entire CBT area will be jam packed by the buses itself. The first proposal is to shift the bus stand completely to the newly constructed bus stand which is away from the CBD area. HDMC should take action in restriction of long route buses to enter into the old bus stand. The following are the advantages of shifting the bus stand:
- Reduce congestion in the CBD area.
- Creates extra space for the local buses.
- The CBT bus stand which is vacant can be used for a parking lot.
Restriction on TRUCKS entering the city from 9.00am to 9.00pm
The second proposal is to put a restriction on trucks and heavy vehicles on entering into the city from 9.00am to 9.00pm. Majority of cities have already implemented restrictions. HDMC should take action in restriction of trucks and heavy vehicles in to enter into the city. The following are the advantages of the restrictions.
- Reduce congestion in the CBD area.
- It prevents curbside loading and offloading.
- It improves the capacity of roads.
- It improves the speeds.
Restriction on traffic entering from crossroads.
There are many crossroads along the old PB road intersect the main traffic flow. Traffic regulation by allowing the cross flow at a particular point will increase the capacity of the main road.
With these modifications, the final LOS obtained for the different intersections was obtained and given in Table 8. The result shows that except Shiva Sagar junction, all other intersections have reached the required LOS. The lesser LOS in Table 8 is the roads with minor traffic flow and which means Stop and Proceed for those movements as explained earlier.
| S NO. | NAME OF THE INTERSECTION | NAME OF THE LEG | LOS |
|---|---|---|---|
| 1 | TOLL NAKA | Dharwad | D |
| Hubli | D | ||
| Bypass | F | ||
| 2 | BAGALKOT PETROL PUMP JUNCTION | Dharwad | C |
| Hosayellapur | F | ||
| Hubli | D | ||
| Malmaddi | F | ||
| 3 | NTTF JUNCTION | Jubilee circle | A |
| Hubli | A | ||
| Line bazaar | E | ||
| 4 | LAKSHMI THEATRE JUNCTION | Jubilee circle | D |
| Hubli | A | ||
| Taluk office | F | ||
| Line bazaar | F | ||
| 5 | COURT JUNCTION | Railway Station | E |
| Line bazaar | A | ||
| Hubli | D | ||
| DC Compound | A | ||
| CBT Circle | D | ||
| 6 | KALABHAVAN (JUBILEE) JUNCTION | KCD | C |
| Line bazaar | A | ||
| Hubli | D | ||
| Belgaum | C | ||
| CBT Circle | D | ||
| 7 | DHO (OLD DSP) OFFICE JUNCTION | Belgaum | B |
| Hubli | D | ||
| Shivaji circle | F | ||
| KCD | B | ||
| 8 | CBT CIRCLE | Jubilee circle | C |
| Corporation office | F | ||
| Shivaji circle | A | ||
| Vivekananda circle | F | ||
| 9 | KCD CIRCLE | Jubilee circle | C |
| KUD | A | ||
| AIR | A | ||
| Dasankoppa | F | ||
| KCD College | A | ||
| 10 | SHIVAJI CIRCLE | DHO Office | F |
| Regal theatre | A | ||
| Soudhatti | C | ||
| Navalgunda | F | ||
| 11 | SHIVA SAGAR JUNCTION | Tikare road | F |
| Subhas road | F | ||
| Jakkanbhavi | F | ||
| Bus stand | F |
CONCLUSION
Traffic management measures normally involve traffic engineering improvements, regulation and control of the movement of a different category of vehicles on the road system to ensure safe and efficient movement of traffic. The problem of delay, congestion and accidents can be decreased to some extent by controlling the traffic, imposing regulatory measures and enforcing proper management of road space so as to make the most economical use of the roads. Due to the movement of a heavy volume of traffic, many of the narrow roads get choked thereby needing the enforcement of traffic management measures such as one-way streets, restriction on commercial vehicles within the city, restriction on turning movements and closing side streets. Heavy commercial vehicles occupy considerable road space and cause serious impediments to traffic. Closing the busy roads for commercial vehicles will preserve the utility of the roads, improve the speed, safety and comfort of other road user. Traffic management measures proposed are based on the findings of the study carried out in Dharwad city.
CONSENT FOR PUBLICATION
Not applicable.
CONFLICT OF INTEREST
The authors declare no conflict of interest, financial or otherwise.
ACKNOWLEDGEMENTS
Declared none.

