All published articles of this journal are available on ScienceDirect.

Congested Urban Areas with High Interactions Between Vehicular and Pedestrian Flows: A Cost-Benefit Analysis for a Sustainable Transport Policy in Naples, Italy
Abstract
Introduction/Methods:
A significant application of the Sustainable Urban Mobility Plan of Naples, in southern Italy, will be described with specific reference to design a sustainable transport scenario for one of the highest density and congested area of the city: Municipio square, in the centre of Naples, where the homonymous station of the Metro Line 1 was under construction. The particularity of this case study is that Municipio Square is a high dense population area characterized by multimodal traffic flows (vehicles and pedestrians) and a thousand of travellers who embark/disembark every day from the marina to the islands of the Naples Gulf (e.g. Capri, Ischia) and cruises around the Mediterranean Sea. Thousands of vehicles and people pass through the square every day, often slowing the vehicular flows.
Starting from these considerations, a multi-scale modelling architecture (estimated ad-hoc for the specific case study) was proposed to better evaluate policy impacts (e.g., transport, social, environmental), applying both macroscopic and microscopic simulation models simultaneously to design a sustainable transport scenario in term of both geometrical and traffic solutions.
Results:
Six different design scenario were compared and the main results of the most significant one are described and discussed. The best project solution reduces the average travel time and the long queues thanks to a better distribution of the flows (both vehicles and pedestrians) in the broader area around of Municipio square. The simulation results also underlined the benefits for pedestrians related to the presence of different size of sidewalks and paths.
Conclusion:
Because of the realization of the new metro station will increase the pedestrian flows, the external layout of the square was designed, regarding infrastructures and paths, to minimize the conflicts and reduce the overall travel time. The proposed sustainable transport scenario was conceived in term of best geometrical devices and traffic solutions.
Finally, a cost-benefit analysis was also proposed, according to the European guidelines, aiming in improving transport, urbanistic, artistic/cultural, aesthetic, economic and environmental aspects as well as liveability for citizens, transport users (public and private) and tourists.
1. INTRODUCTION
In recent years, European urban areas showed the need to have more planning and management tools to achieve a more sustainable, accessible, efficient and competitive urban mobility. In 2014, the European Commission released “Guidelines for developing and implementing a new look for sustainable urban mobility” [1] with the specific aim to involve citizens, stakeholders and decision makers in the coordination among different urban policies (transport, land use, environment, economic, social and energy) in a more comprehensive transportation planning.
While the traditional transportation planning procedure was characterized by some limitation related to the policy areas involved in the plan (e.g., parking, roads, public transport services), the new Sustainable Urban Mobility Plan (SUMP) proposed by European Commission represents a more “ampleplan” integrating all the stakeholders involved (e.g., citizens, decision-makers as local and national authorities, professionals and transport users). So, a multidisciplinary approach should be complemented into its development, embracing environmental, urbanistic, economic social and transportation sectors. Compared to “traditional” urban transportation plans, SUMP moves the focus from traffic to people with significant advancements in the direction of a sustainable mobility (e.g., explained in Cartenì [2]) jointly with the quality of life. According to the European Guidelines, a SUMP is well defined as “a strategic (long period) transportation plan aimed to improve welfare of both peoples and workers living in the city as well as in its surrounding area”. Since very few years, different European cities are developing their SUMPs (or part of them). Also in Italy even if only recently (October 2017) an Italian specific guideline was approved [3]. To better underline the main differences between the SUMP and the traditional transportation urban plan, the following table of comparison was proposed (Table 1).
| Traditional Transportation Urban Plan | Sustainable Urban Mobility Plan (SUMP), according to the EU Guidelines | |
| Limited area involved in the plan (e.g. administrative city area) | → | Functional area (and not administrative) involved in the plan in a vision of an “ample plan” |
| Plan implemented by technical designers | → | Plan implemented by multidisciplinary technical designers and stakeholders |
| City administration as the unique decision maker | → | Public Engagement for a participated and shared plan |
| Limited monitoring of the impacts produced by the plan | → | Extensive monitoring for quantify all the main impacts produced by the plan |
| The vehicle flows (private and public) is the aim of the transportation planning | → | The citizen and the quality of life is the aim of the transportation planning |
| Infrastructure or service interventions often in a mono-modal vision | → | Infrastructure or service interventions in a multimodal integrated (network) vision |
| Environmental impacts only marginally considered (transport externality) | → | Sustainable mobility as a primary aim of the urban transport planning |
The city of Naples, in the south of Italy, in 2016, has already formalized the first acts of its SUMP. For developing this new Plan, in compliance with the European guidelines, the city has proposed an application at urban scale of a theoretical planning decision-making process, proposed in Cascetta et al. [4]. This innovative methodological approach introduces a complex planning process based on “three legs” corresponding to the three main actors involved (technical planners, decision-makers and stakeholders) in three parallel and intertwined processes: i) the use of quantitative methods for all the technical activities (e.g. impacts estimation; cost-benefit analysis to compare multiple design scenarios; ii) a bounded rational decision-making process; iii) the stakeholder engagement process. The bounded rational model assumes that actors are still goal-oriented, considering at the same time their cognitive limitations in attempting to achieve those aims. Furthermore, since different decision-makers are involved in a transport planning process, it is very likely that their aims are diverse and possibly contrasting, not to mention those of the variety of stakeholders involved in the process. This new planning process aims to find a satisfactory compromise rather than the optimal solution (“perfect is the enemy of good”, recites a well-known aphorism). Following this methodological approach, as explained in details in [5, 6], the process followed in Naples SUMP was rational, adaptive and participatory and inherently dynamic with objectives that can be reformulated until achieving a really sustainable mobility system. The SUMP’s vision for such a complex city (taking always into account the dynamic evolution of its definition) has as core a shared mobility system, including traditional urban public transport systems and bike, car and taxi sharing services. To this aim, the city of Naples considers to be necessary to connect and integrate private and cycle-pedestrian mobility using advanced ITS technologies, implementing both Advanced Travelers Information Systems (ATIS) and Advanced Traffic Management Systems (ATMS).
Moreover, this new decision-process seems to be able to lead to decisions economically rational, especially in this historical period of economic narrowness. Also from this specific point of view, recent studies identified the importance of rational decisions in transport planning [7] with the aim to define the right mixture of interventions to be implemented on the transport system. This allows to reduce costs (impacts) in terms of congestion, traffic accidents, travel time, that is also able to save people’s health and the environmental (e.g., emissions reduction) and requires minimal economic resources (e.g. lower monetary cost per unit of CO2 saved).
These policies are very different concerning of costs and expected benefits, and their effects and combinations are trying to anticipate on a purely intuitive basis, and sometimes the outcome could be contrary to the expectations (e.g., policies aimed to reduce pollution, ending up in increasing it). In this context, the concept of “eco-rational planning” assumes a central role as proposed in Cartenì [2].
Another specific characteristic of Naples SUMP is to improve public transport quality [8, 9]. Transit services quality has long been recognized as an important factor in influencing travellers’ behaviour and terminals quality is certainly part of it. As a matter of fact, many transit promotion policies explicitly based on qualitative factors and specifically high architectural standards are being adopted in designing new railways stations and several examples of remarkable architecture applied to railways stations can be found all around the world. Despite this, the literature in transportation modelling has not yet analysed the impact of the hedonic quality on travellers’ behaviour quantifying whether and how much it increases their propensity to use public transport services.
Starting from this consideration, the aim of the paper was to propose a significant application of the SUMP of Naples with specific reference to the design of a sustainable transport scenario for one of the highest density and more congested area of the city where a new station of the Metro Line 1 was under construction. Furthermore, a multi-scale modelling architecture was also proposed to better estimate policy impacts (e.g., transport, social, environmental), applying simultaneously both macroscopic and microscopic simulation models (implemented ad-hoc for the case study).
The particularity of this case study is that the application case study is characterized by: i) a high population density; ii) a high multimodal traffic flows (vehicles and pedestrians); iii) the presence of the marina with thousands of travellers who embark/disembark every day for the islands of the Naples Gulf (e.g. Capri, Ischia) and cruises around the Mediterranean Sea. So, thousands of vehicles and people pass through the square every day, often slowing the vehicular outflow.
Furthermore, because of the realization of the new metro station will increase the pedestrian flows, the external layout of the square was designed, regarding infrastructures and paths, to minimize the conflicts and reduce the overall travel time. The proposed sustainable transport scenario was conceived in term of best geometrical devices and traffic solutions. Finally, a cost-benefit analysis was also proposed, according to the European guidelines, aiming in improving transport, urbanistic, artistic/cultural, aesthetic, economic and environmental aspects as well as liveability for citizens, transport users (public and private) and tourists.
The paper is organized as follows: in the next section, the main elements of the methodological approach are summarized; afterwards the case study, the mobility surveys, the demand analysis and the simulated scenarios are described and discussed. Then, results both for traffic and pedestrian flows will be given. Finally, the main conclusions will be reported.
2. METHODOLOGY
The first activity in a cost-benefit analysis is the estimation of the benefits (impacts) produced by an intervention (the revamping of Municipio square in Naples Italy) in terms of demand flows variations (vehicles and pedestrians) in different times periods (peak and off-peak hours/days/mouths).
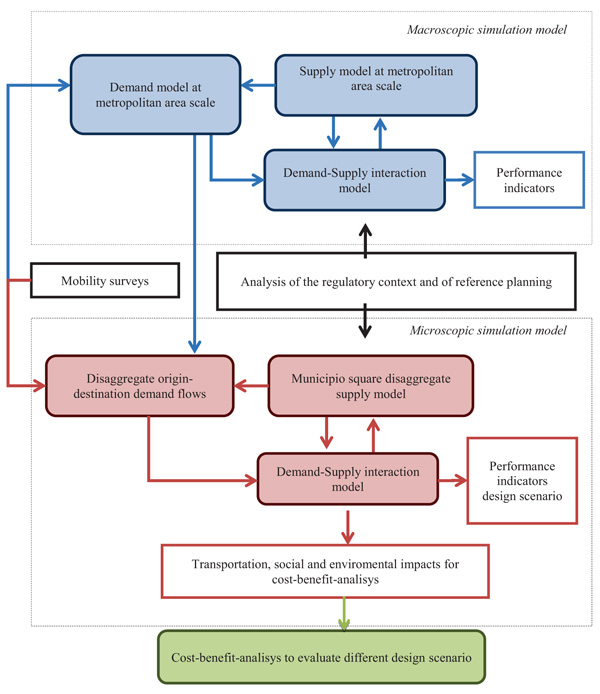
As the study area (described in next section) is characterized both by local and crossing flows coming from different zones of Naples metropolitan area (about 3 million inhabitants), it was necessary to implement an ad-hoc estimation methodology (schematized in the following Fig. (1)) that combine macroscopic simulation models (to estimate the macro-flows coming from the metropolitan area and impacting the study area) and microscopic ones, to accurately estimate by using traffic simulation models [10, 11], the micro-impacts caused by the interferences of pedestrian and vehicular flows at the intersections and at pedestrian crossings.
The macroscopic simulation model had the aim to estimate the traffic flows in a larger area both in the base situation (reference scenario) than in design ones. It has allowed to estimate and verify the effects of different infrastructural design solutions (e.g., geometry, regulations, paths) in term of paths followed, travel times and congestion level in different time periods. The model has also allowed to calculate all the synthetic indicators useful to evaluate the proposed design scenario and eventually integrate and/or modify them.
The macroscopic simulation model was composed by a within-day static models with variable demand (for details see also [12, 13]:
- A supply model with urban cost functions [14], where the link impedance generalized cost was equal to:
- The sum of the travel time (in a congested network for the car mode) and the fuel monetary cost for the car mode [15];
- The sum of a travel time and the ticket price for the public transport mode;
- A standard multimodal Logit demand model with both level of services and socio-economic attributes [16-19];
- An elastic Stochastic User Equilibrium (SUE) assignment model for congested network [20].
The microscopic simulation model, applied to case study has allowed to verify (both for vehicle and pedestrian microscopic flows): the followed paths, travel times, length and location of the queues over the time. It has also testing different design scenarios to optimize the pedestrians’ paths within the square and towards the ports. As known, this modelling approach allows, not only to estimate the performance measures values of traffic flows [21], but also to better estimate the interactions (and their evolution over time) between vehicle and pedestrian.
Finally, the proposed simulation tool has allowed estimating all the specific indicators useful for assessing the cost-benefit analysis needed to choose the best project scenario to implement.
The two models approach designed were calibrated (estimation of the models’ parameters) and validated through ad hoc mobility surveys (see the next paragraph for details), in addition to the data already available for the case study considered.
As said, one of the aims of the paper was to perform a cost-benefit analysis; to do this were estimated the social benefits (impacts) deriving from: i) different design scenario; ii) the opening of a new Metro station. For the case study the European cost-benefit analysis guidelines [22] was applied estimating the benefits produced for vehicles and pedestrians, and the externalities for the non-users. Through the micro simulation tools, was possible to estimate the differences between the reference scenario and design ones in terms of performance indicators (e.g. queue lengths; average travel times; number of pedestrian flows at crossings). Specific benefits for pedestrians were estimated in function of both the type and extension of sidewalks and the paths followed in each design scenario. Furthermore, benefits for the vehicle users were also estimated in term of travel time reduction for crossing the study area (also in term of queues reduction). Finally, for each design scenario, externalities were estimated in term of variation in: i) greenhouse gas emissions; ii) pollutant emissions; iii) noise pollution, iv) road accidents.
3. CASE STUDY, MOBILITY SURVEYS AND DEMAND ANALYSIS
3.1. Description of the Investigated Area
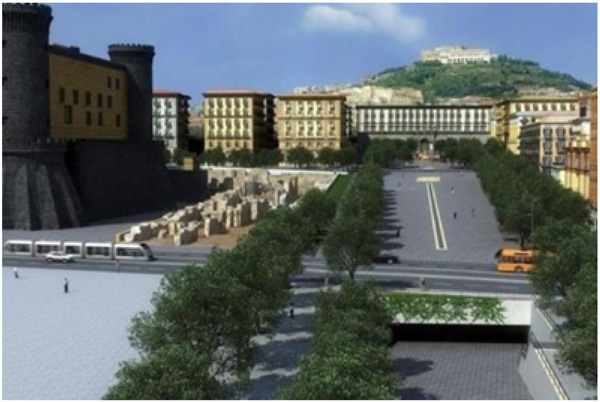
In the present work, as said, a significant application of Naples SUMP with specific reference to the design of a sustainable transport scenario for one of the highest density and more congested area of the city. The territorial area object of the analysis was the Municipio Square in the centre of Naples, where a new station ‘Municipio’ of the Metro Line 1 was under construction. This Metro Line, famous for its ‘art stations’ (‘Toledo’ station, for example, was defined as ‘The most impressive underground railway stations in Europe’ by The Daily Telegraph [10]), is an important example of high quality design aimed at achieving multiple objectives.
For the design of the layout of this area was considered both vehicular traffic flows (private and public transport) and the huge pedestrian flows. In fact, the attractiveness of this place is manifold. Inside the square there is the Maschio Angioino Castle; in addition, close to the square, within walking distance, there are other sites of historical interest (the Galleria Umberto I, the San Carlo Theatre, the Royal Palace and Plebiscito square) and some commercial sites (Via Toledo, Corso Umberto). Furthermore, this area is a link between the city and the sea: Municipio Square, that has a large extension, borders the marina and, daily, many tourists arrive in Naples with cruise ships. Finally, it can be noted that the square also represents a great attraction place for residents, given that the local government building, many other offices (e.g., banks, insurance companies) and an historical theatre (Mercadante Theatre) are located in. The new Metro station, also characterized by the presence of important archaeological finds (that will become a “compulsory” museum for all users who will pass through it), is further increasing the attractiveness of the area for pedestrians.
Also from the transport point of view, Municipio square plays a central role for the city of Naples. In fact, the adjacent roads (Via Acton, via Medina and via Cristoforo Colombo) are identified as primary urban roads. The two coastal routes (Via Caracciolo-Via Acton- via Colombo-Via Marina and Via Marina-Via Depretis -Piazza Municipio-Via Acton-Via Riviera di Chiaia) are a forced route for west-east-west urban traffic.
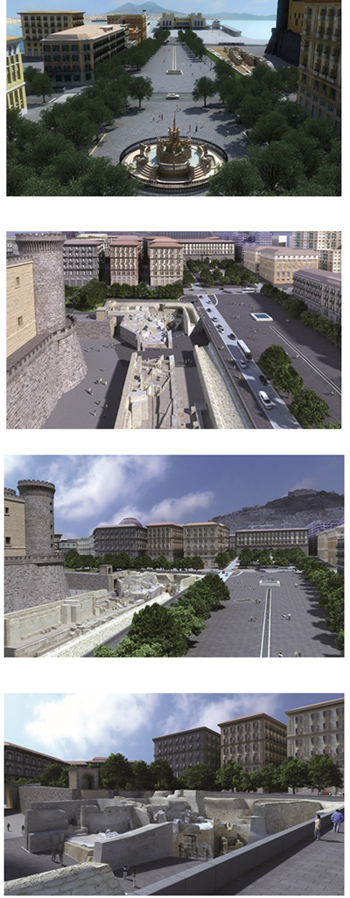
The final design layout of Municipio square is reported, with three different point of view, in the next Fig. (2).
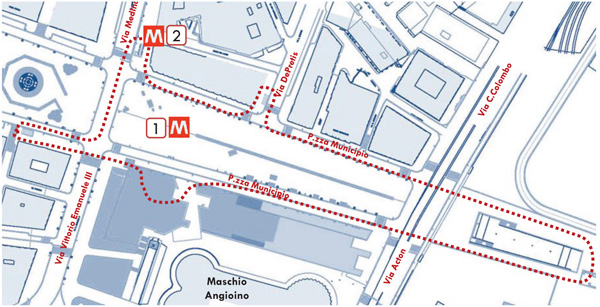
The pedestrian area will be the central part of the square with an extension of about 12,500 m2; the vehicles will have two roads with two lanes (3.5 m wide). It will be realized a pedestrian underpass (equipped with escalators, lifts and treadmills) to connect the square both with marina and Metro Line 1, following the double aim of facilitating the pedestrian routes and reducing the traffic congestion by means of limiting the inferences between people and cars. Finally, the Metro Line 1 will have in this area 5 entry/exit points (Palazzo San Giacomo, via Medina, via Depretis, Porto, Scavi Archeologici) to ensure a wider accessibility all around the square. At the moment, the Metro Line 1 have, in the zone of interest, two already operating entry/exit points (Palazzo San Giacomo, via Medina) as illustrated in the following Fig. (3).
Using a complex zoning process, it was possible to concentrate, on a limited number of points, the trips with origin destination from/to the studied area. For example, with respect to the macroscopic model implemented, 399 traffic/ zones were defined (through different transportation criteria) of which 253 inside the city of Naples and 146 within the external areas. The zoning process, used in this work, is consistent with the supply model that is intended to simulate: more detailed near the city centre, less dense towards the peripheric area.
3.2. Mobility Surveys and Demand Analysis
A specific survey campaign was performed aimed: i) to estimate the incoming and outgoing vehicles flows to/from the study area; ii) to estimate percentages of vehicles turning maneuverers at main intersections. A preliminary survey has allowed identifying the peak period (maximum vehicular and pedestrians interactions and congestion). The test-survey was performed both in winter and in summer of 2016. These allowed to identify that peak period for pedestrians and vehicles are the months of June and July. Starting from these considerations, 21 counting sections were monitored for 15 weekdays (10 business days and 5 holydays) in June and July 2017, both in the peak hours of the day and in the off-peak ones. Both vehicular and pedestrian flows were surveyed. For vehicles flows the following types of information were collected: geometrical characteristics of roads and intersections (cross sections, number and width of lanes, presence and dimensions of roadside parking and pedestrian crossings); type of intersections; characteristics of the traffic light (cycle time, number and duration of phases); number and characteristics of vehicles (cars, motorcycles, buses, taxis and light and heavy goods vehicles) in different hours of the day; percentages of turning maneuverers, per type of vehicles and intersections; traffic flows for each lane and queues lengths and propagation, through traffic surveillance cameras Through these monitoring, was also possible to (anonymously) read the license plates of the vehicles to estimate the origin-destination matrix (O/D matrix) and to evaluate the travel times for each origin-destination and vehicle categories identified.
Finally, for better calibrate the implemented models, speeds, free flow travel times and queues length at main intersections of the study area have been measured.
For pedestrian flows, a Revealed Preferences (RP) survey was performed, in order to estimate the mobility behaviours of a sample of users. Such surveys were carried out by interviewing pedestrians at specific points of the transport system (e.g., at the main pedestrian crossings of the project area). The submitted questionnaire to about 300 pedestrians allowed to collect: gender, age, purpose and frequency of the trip, number of “travel friends”, origin and destination of the trip and path followed in the square (to be chosen among those shown on a map proposed to the interviewed). In fact, the peculiarity of the square allowed to identify only a few possible paths (4-7 from the interview point) among which a pedestrian can choose how to move. Jointly with the interviews, pedestrian counts were also made in 21 sections. The combined use of the counts (sampling universe) and the results of the interviews (sample interviewed) allowed, through the application of consolidated statistical inference technique, to estimate the number of pedestrian crossing over the time and estimate the O/D matrix for both the morning and the evening peak hours.
Through the estimated models, was possible to compare the impacts of different design scenarios through the evaluation of both Global Indicators (e.g., total time for crossing the study area [h], maximum queue length [m], number of vehicle per km and number of vehicles simultaneously present in the study area/vehicular density), and Local Indicators (e.g., average length of queue at each road lines [m]).
The measurement campaign results show that the study area is affected by a daily vehicle traffic of about 80,000 Passenger Car Equivalent (PCE), equally divided during the morning time period (8 a.m. to 2 p.m.) and afternoon ones (2 p.m. to 8 p.m.). In term of hourly trends (Fig. 4), the morning peak hour (from 8 a.m. to 9 a.m.) presents 7,500 equivalent cars (equal to about 10% of the daily flow: respectively 52% cars, 5% taxis, 37% motorcycles, 5% heavy good vehicles, 1% buses).
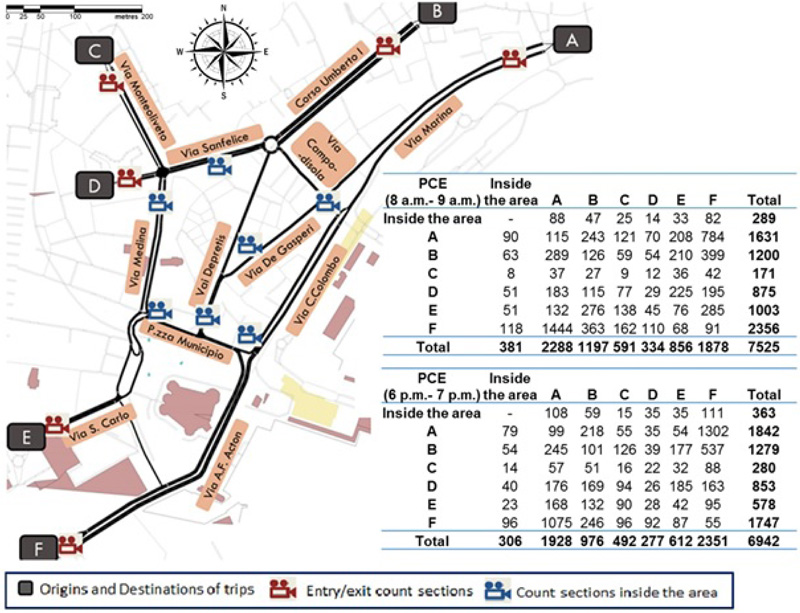
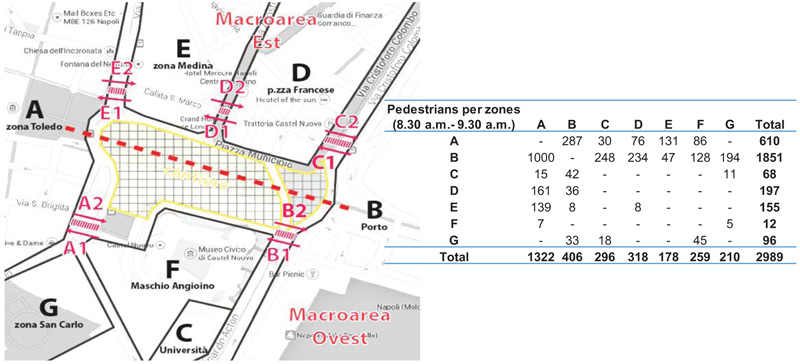
Regarding the pedestrian survey, the results indicate that 52% of users move for tourism (of which 50% occasionally or once a week) and the remaining 48% for work or study reasons (of which 50% every day or 2/3 days a week). The employed people are 47% of the total, the students 18%, the unemployed 10% and the tourists 25%. Almost 3,000 are the pedestrians that move in the whole studied area (of which 60% are the movements in the marina area, while the remaining 40% regards via Toledo shopping street and surrounding areas). The following Fig. (5) shows the O/D matrix in the case of maximum pedestrian load: the assumption of maximum load is the sum of all transport modes, also that of cruise ships. This last is strongly variable and depends on the number of cruise ships moored at the seaport. In minimum load situation, the pedestrian movements are 30% less.
3.3. Simulated Scenarios
Different layout design scenarios regarding Municipio Square were tested. They can be summarized as follows. For the wide area around Municipio square, 3 basic traffic schemes (that differ with each other for driving directions, number of lanes, lanes width and pedestrian paths) have been compared. In each of these scenarios, in the west part of the area has been foreseen by the design of a new roundabout at the intersection among the following roads Via S. Carlo, via Gongaza and Via V. Emanuele III. This new roundabout (Fig. 6a), allowing to facilitate the manoeuvres at the intersection and moderate vehicles speeds, was considered a fixed point for all the scenarios.
On the contrary, in the east zone for the area called Largo Immacolatella, two different solutions have been evaluated (see Figs. 6 b1 and b2). These ones differ from each other for the presence/absence of traffic lights and, consequently, for the different number of lane and their different widths.
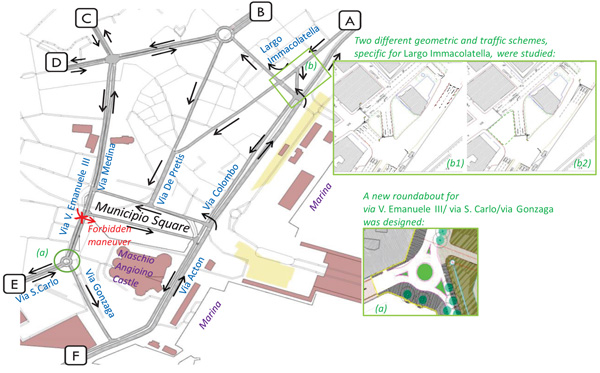
Overall, 6 different design scenarios were simulated and just the results relative to the most significant one (whose main features are generally illustrated in Fig. (6) is discussed in the present paper.
4. ESTIMATION RESULTS
The results of the simultaneous application of macro/microscopic models for vehicles and pedestrians, allowed to estimate the performance of the simulated design scenarios. Only for clarity of exposition, two separate sub-paragraphs were proposed in the following to discuss the main results relative to vehicles and pedestrians.
4.1. Results for Traffic Flows
From the transportation point of view, the main simulation results (reported in Fig. 7) show: i) a significant reduction in the queue length (form -35 m to -205 m) due to a better distribution of flows along the new available paths; ii) an increase in the number of vehicle per km due to new longer paths of about 5%; iii) a general decrease in total delay (an increase is showed just for the peak hour in the evening); iv) a significant decrease in the number of the vehicles that cross the Municipio square (-22% in the morning peak hour, while -31% in the evening). Furthermore, among the alternative solutions tested for the east zone of the study area, the best solution appears to be that reported in the previous Fig. (6), producing significant improvement during the peak hours both in the morning and in the evening.
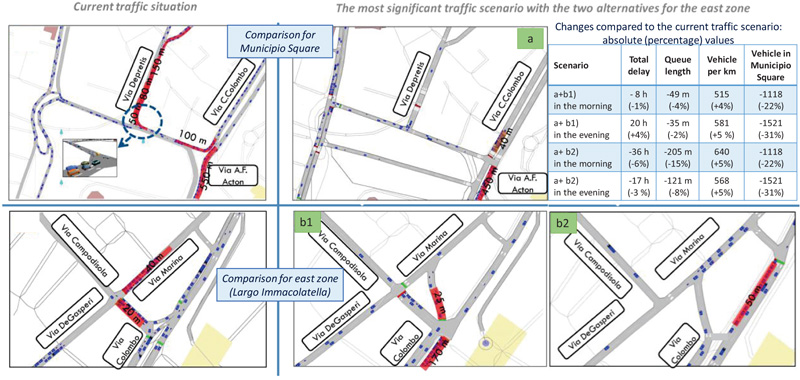
Results relative to the other design scenario tested (not detailed for brevity) show an average increase (with respect to the current scenario) of the length of queues (e.g. in Largo Immacolatella all day, in Via C. Colombo in the morning, in Via Marina in the evening) and the delay, so these scenarios were discarded.
Furthermore, another design scenario was tested considering a vehicle restricted area within the Municipio Square. The results of this scenario were a modest decrease in traffic flows with a consequent of increasing both the overall number of vehicles per km (due to longer paths, see for example the flows from B, C, D to F in the Fig. (5) and the average length of queues, also this scenario has been excluded.
4.2. Results for Pedestrian Flows
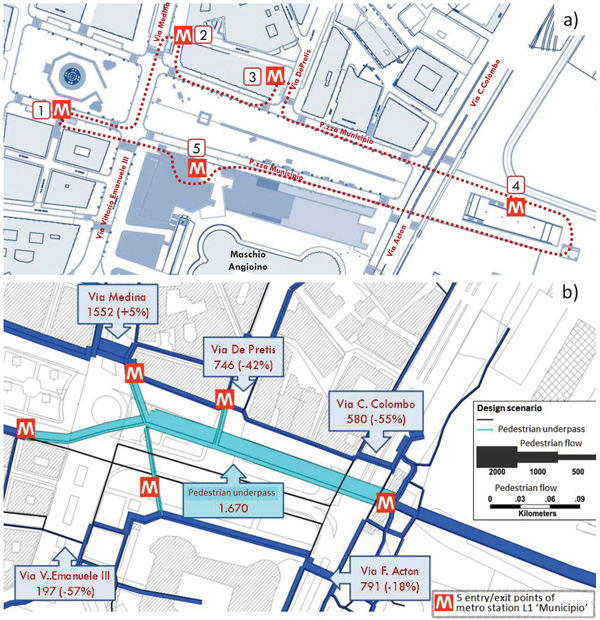
In the morning peak hour (from 8 to 9 a.m.), the pedestrian flows were estimated as follows: the sum, of systematic demand (about 2,000 pedestrians), the cruise tourists (about 1,000), and the generated demand produced by the new station ‘Municipio’ of the Metro Line 1 as detailed in Fig. (8a). Overall more of 3,000 pedestrians that simultaneously pass through the study area were estimated. The following Fig. (8b) shows the simulated pedestrian flows along the available paths in the study area and the ones entering/exiting the new Metro station.
4.3. Social Benefits of the Pedestrian Underpass
As said, one of the aims of the paper was to perform a cost-benefit analysis aiming in improving transport, urbanistic, artistic/cultural, aesthetic, economic and environmental aspects as well as liveability for citizens, transport users (public and private) and tourists of the study area. The analysis was performed according to the European guidelines [23] and a recent research study [24].
The main infrastructures implemented relative to the best design scenario is the pedestrian underpass reported in Fig. (9).
The comparison among the project alternatives was performed through the difference between costs and benefits over the years. Defined and quantified (in monetary terms) impacts related to the new infrastructures (for each design scenario), some Measure Of Effectiveness (MOE) were estimated. Net Present Value (NPV) is the measure of the profitability of an investment that is calculated by subtracting the present values of cash outflows (including initial cost) from the present values of cash inflows over a period of time. Pay Back Period (PBP) is the period of time required to recoup the funds expended in an investment, or to reach the break-even point (return of the investment). The selection of the best project scenario to develop was defined comparing the MOE indicators estimated. Three different underpass scenarios were compared: i) no underpass but rationalization of pedestrian crossings; ii) “short underpass”, which is an underpass that allows to cross only half square in underground (with about half benefits produced); iii) “long underpass” that allows to cross all the square in underground. Table 2 shows the comparisons between the simulated scenarios in terms of estimated MOEs.
| MOE / Scenario | No Underpass | Short Underpass | Long Underpass |
|---|---|---|---|
| Average reduction of vehicles queued | -20% | -30% | -35% |
| Vehicles average waiting time at the intersections variation | From 0 to - 0.5 minutes per vehicle |
From -0.8 to - 1.4 minutes per vehicle | From -2.4 to - 3.2 minutes per vehicle |
| Vehicles fuel consumption in crossing the study area variation | -0.005 € per vehicle | -0.08 € per vehicle | -0.20 € per vehicle |
| Vehicles pollutant emissions variation | 500 g of equivalent CO2 per vehicle | 500 g of equivalent CO2 per vehicle | -500 g of equivalent CO2 per vehicle |
| Realization cost (2017 price) |
1 million € | 10 million € | 13 million € |
| Net Present Value (NPV) (2017 price) |
-0.4 million € for 6 years 1.2 million € for 20 years |
16 million € for 6 years 28 million € for 20 years |
40 million € for 6 years 70 million € for 20 years |
| Pay Back Period (PBP) | 10 years | 6 years | 3 years |
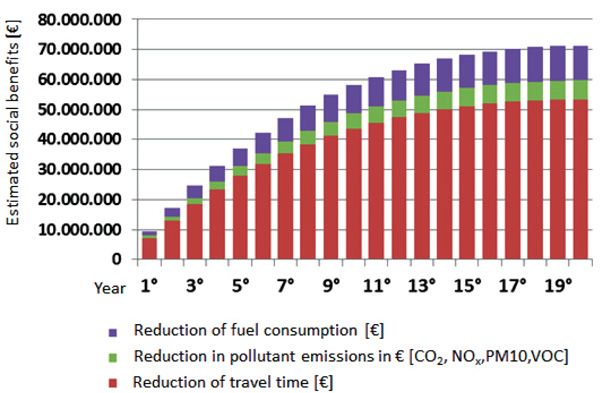
As reported in Table 1, the best solution is the “long underpass” that, although it is the one with the highest implementation costs, will produce the greatest benefits that are (Fig. 10):
- An average reduction of vehicles queued by -35%, compared to the scenario without a pedestrian underpass;
- A reduction in average waiting time at the intersections of 2.4 - 3.2 minutes per vehicle;
- A reduction of fuel consumption of about 0.20 € per vehicle;
- A reduction in pollutant emissions of about 500 g of equivalent CO2 per vehicle crossing the study area.
All these benefits will produce more than 40 million € for 6 years and more than 70 million € for 20 years. Comparing them to the construction costs was estimated a Pay Back Period lower than 3 years and a positive Net Present Value. Finally, a sensitivity analysis was also performed, confirming the robustness of the design solution implemented.
CONCLUSION
The city of Naples in the south of Italy, in 2016, has already formalized the first acts of its Sustainable Urban Mobility Plan according to the recent European Guidelines. For developing this complex plan, the city of Naples has proposed an application at urban scale of a theoretical planning decision-making process.
In this paper, the authors present the results of the first application of this innovative methodological approach, with specific reference to design a sustainable transport scenario for one of the highest density and more congested area of the city. A multi-scale modelling architecture was proposed by applying both macroscopic and microscopic simulation models simultaneously. Six different design scenarios were compared.
Finally, a cost-benefit analysis was also performed according to the European guidelines, aiming in improving transport, urbanistic, artistic/cultural, aesthetic, economic and environmental aspects as well as liveability for citizens, transport users (public and private) and tourists.
The proposed application, even if limited to a small part of the city, has allowed testing the proposed methodology. The main results suggest that this tool could be used as a rational transportation planning procedure as envisaged in EU guideline for the SUMP. Among the research perspectives there is the application of the overall methodology to the entire municipal territory of Naples (much more extensive and with more complex problems of vehicle-pedestrians interactions).
Furthermore, the proposed methodology will be applied to other cases studies, to evaluate the models’ transferability to other contexts both Italian and international.
CONSENT FOR PUBLICATION
Not applicable.
CONFLICT OF INTEREST
The authors declare no conflict of interest, financial or otherwise.
ACKNOWLEDGEMENTS
Thanks to Transportation Municipal Councillor, prof. Mario Calabrese, for the support and the assistance provided. Thanks also to Metropolitana di Napoli S.p.A. for the data and material provided.

