All published articles of this journal are available on ScienceDirect.

Characterization of Mobile Work Zone Safety in Missouri
Abstract
Work zones often deviate from normal conditions in terms of geometrics (e.g. lane closure, narrow lanes), striping/markings, signs, and traffic. A Mobile Work Zone (MWZ) is a special category of a work zone where the location of the work zone keeps changing, often rapidly. Despite MWZ safety being of great interest to transportation agencies, they have not studied it formally. This paper presents an examination of MWZs and collisions involving Truck-Mounted Attenuators (TMAs). This examination utilized data fusion of three major databases from Missouri: crash reports, department of transportation claim reports, and MWZ schedules. The fused dataset involved 139 crashes from 2012-2017. The areas of interest included initial impact location, contributing factors, third-party versus employee fault, vehicle type, work zone activity, seasonality, speed limit, time of day, collision lane, and work train configuration. The majority of the crashes were the fault of third parties (>80%) and distraction/inattentiveness was the largest contributory factor (66%). Public outreach and education should emphasize on the difficulty in providing early warnings of MWZs. There is a significant percentage of crashes involving lane changing (39.2%) and even collision of the middle TMA truck (21.8%). Thus, it is important for the public to understand that an entire work train is an integral unit. Higher speed limit dominated MWZ crashes (>75%), even though they only represented 3.6% of the MWZs scheduled. The results of this study on MWZs provide some foundation for other researchers to pursue statistical modeling, assuming that a larger database of MWZ crashes could be developed.
1. INTRODUCTION
Work zone safety is an area that has received significant attention in the transportation community. Several researchers have compared work zone crash frequency and severity with non-work zones [1-6]. Others focused on modeling work zone crashes, including crash frequencies using variables such as Annual Average Daily Traffic (AADT), duration, and length, and some even included variables related to detour signage, lane shifts, and lane splits [4, 5, 7-10]. Several studies examined traffic control devices, including Truck-Mounted Attenuators (TMAs). Humphreys et al. (1991) [11] summarized the feedback from the use of first-generation TMAs and reported improvements of highway safety. Garber et al., (1998) [12] found that changeable message signs with radar reduced speeding and, consequently, crash rate and severity. Smith et al., (2006) [13] found that advanced warning systems using TMAs resulted in fewer drivers reacting in the last 300 meters approaching a work zone. The following are some examples of more recent research related to work zone safety. Clark and Fontaine (2015) [14] investigated whether crashes near work zones were truly due to the presence of work zones. Eustace et al., (2015) [15] examined the effects of left-and right-side merging, light, roadway pavement, drivers’ age and presence of construction work zones. Ullman et al., (2016) [16] analyzed the effect of the Intelligent Transportation System (ITS) combined with Portable Rumble Strips (PRS) at nighttime temporary work zones. Rahmani et al., (2016) [17] calibrated crash modification factors for the Midwest using the Highway Safety Manual. Domenichini et al., (2017) [18] assessed drivers’ behavior in response to nine different configurations of crossover work zones using a driving simulator. La Torre et al., (2017) [19] performed the empirical Bayes before-and-after method to evaluate the effect of stationary work zones on freeways in Italy. Harith et al., (2018) [20] studied rear-end crashes in the context of the connected vehicle environment. As seen in the literature, Mobile Work Zones (MWZs) have not been the subject of any academic studies.
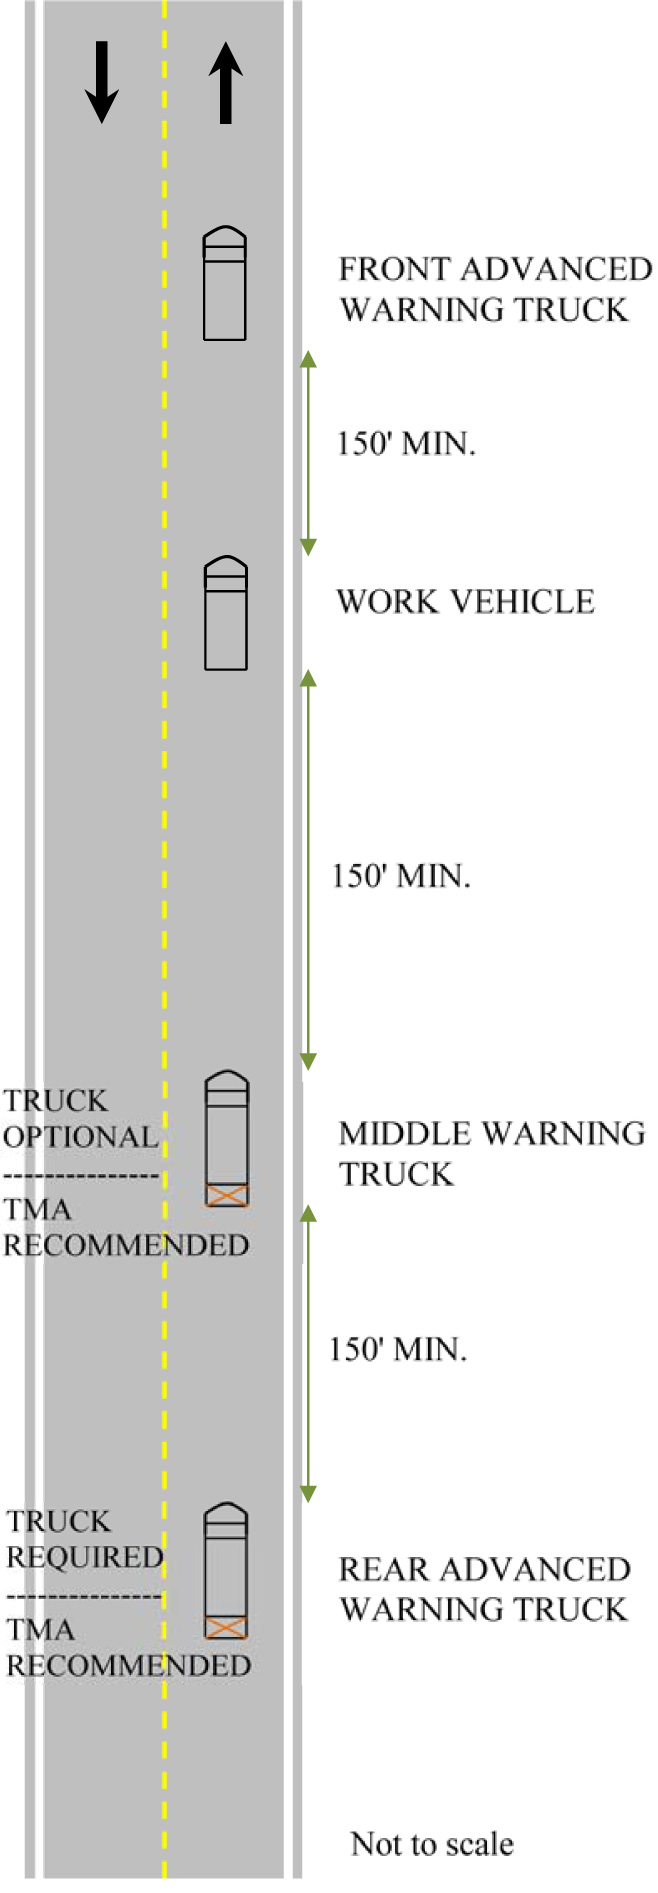
Mobile Work Zone (MWZ) duration is defined in Section 6G.02 of the Manual on Uniform Traffic Control Devices (MUTCD) (FHWA, 2008) [21] as a zone that moves intermittently or continuously. MWZs include activities such as striping, sweeping, pothole filling, shoulder repair, and mowing. Such MWZs often travel at low speeds, such as 15 mph or slower, while the approaching traffic could be traveling at a regular speed of 50 mph or higher, depending on the type of facility. This high differential in speed between the MWZs and the approaching traffic is a motivation for analyzing MWZ safety. Due to moving nature, the use of static advance roadside signage is not optimal, unlike in stationary work zones. Truck-Mounted Attenuators (TMA) are deployed in MWZs to mitigate crash impact and to protect workers and the traveling public. Fig. (1) shows an example of a typical MWZ application involving centerline/edge line striping on two-lane highways. This figure shows a mandatory rear advanced warning truck and the recommended TMA. An optional middle warning truck is shown, also with a recommended TMA. Even though MWZs are common to many transportation agencies, there has not been a study that reviewed MWZ crashes and incidents in detail to begin to better understand MWZ safety. In contrast, there has been significant research on stationary work zones. Cottrell (2015) [22] examined TMA crashes in Virginia by surveying agency staff and contractors and by summarizing TMA crash statistics. They found that driver inattention/ behavior, road geometrics/ sight distance, mobile operations, and not following work area procedures were possible contributing factors to TMA crashes. Although they did not have evidence, they theorized that mobile operations are more likely to have TMA crashes. This paper builds upon previous research by presenting evidence of TMA crash contributory factors for Mobile Work Zones. With the popularity of smartphones and other devices, drivers have potentially innumerable sources of distraction. Now, more than ever, it is useful to examine the characteristics of MWZ incidents in order to devise strategies for improving MWZ safety.
There is significant literature on how best to implement MWZs. This type of literature provides best practices to improve the safety and efficiency of MWZs. Passwell et al., (2006) [23] identified mobile and short duration work zone traffic control devices in New Jersey with an emphasis on reducing delays and crashes. ATSSA (2008) [21] published a pocket guide on the use of MUTCD temporary traffic control. The guide discussed mobile work activities such as sweeping, pothole patching, vegetation control, and mowing. Hadayeghi and Malone (2009) [24] synthesized mobile lane closure practices in the U.S. and Canada by reviewing existing literature and conducting a survey of public agencies. They found that 64% of agencies did not use equipment to reduce on-foot worker exposure and departments of transportation (DOTs) do not analyze Mobile Work Zone crash data because of the difficulty in differentiating relevant crashes. Steele and Vavrik (2010) [25] analyzed driver behavior around moving lane closures and provided various recommendations on aspects such as truck spacing, buffer space length, arrow board usage, and changeable message sign wordings for different types of lane closures. Wang et al., (2013) [2] evaluated innovative traffic control devices for short-term work zones. They reviewed devices such as adhesive rumple strips, intrusion alert systems, portable speed monitoring displays, and portable rumble strips. ATSSA (2013) [26] and FHWA (2019) [27] presented guidelines for deploying rolling roadblocks for work zones. Rolling roadblocks involve a block/pace vehicle to temporarily closed lane(s). Datta et al., (2016) [28] described the characteristics of short-term stationery, short-duration, and Mobile Work Zones and listed the challenges. They presented possible mitigation strategies for improving work zone safety and efficiency. The current paper provides empirical evidence to support or strengthen certain practices.
Because TMAs are utilized in MWZs, TMA-involved crashes provide a rich source of data for analyzing MWZ safety. The main objective of this paper is to perform a descriptive analysis of TMA-involved crashes. These crashes are documented in police crash reports, but they could also be documented in DOT claim reports. Sometimes, a TMA crash is not captured in a police report for various reasons, such as when a vehicle leaves the scene or the damage reporting threshold is not met. These claim reports are often neglected because they are not digitized in databases and are not as well-known as police crash reports. When both crash and claim reports are available for a specific crash, then these reports could be mined together to obtain a clearer picture of the crash and to correct any inaccuracies.
Crash analysis is often performed using the data from pre-defined fields in crash reports. There is additional information that can be gleaned from diagrams, narratives statements, and claim reports. The use of police crash diagrams and witness narratives provides greater insights into MWZ crashes. Similar to crash reports, claim reports also could contain diagrams and often include statements from workers and sometimes from crew supervisors. These narrative statements provide insight into MWZ operation procedures and policies. For example, a Mobile Work Zone could involve multiple TMA trucks such as the shoulder, rear advance, middle advance, and front TMA trucks. The claim report discusses the configuration of the TMA trucks, information that is unavailable in police reports.
In summary, the following points differentiate this paper from previous literature. This is the first academic study of MWZs and TMA crashes using data fusion of crash and claim reports and the mining of narratives and diagrams. Previous studies have focused on static work zones, but the subset of Mobile Work Zones also adds value to this study. Some previous studies examined TMAs using surveys and field speed measurements. In contrast, the approach here is to use data fusion to analyze MWZs and not just report reactions to types of TMAs. This paper used DOT claim reports, while work zone safety studies often rely on crash reports only. The fusion of crash and claim reports increased the sample size of crashes while providing more details than traditional crash analysis. The mining of diagrams and narratives paints a clearer picture of the sequence of events and the MWZ operations. None of the cited studies utilized the crash report narratives. The use of six years of Missouri data provides an illustrative case study and a template for other states to pursue. Lastly, the characterization of MWZ crashes provides a foundation for others to pursue research avenues such as statistical modeling, crash modification factor development, and countermeasure analysis.
2. MATERIALS AND METHODS
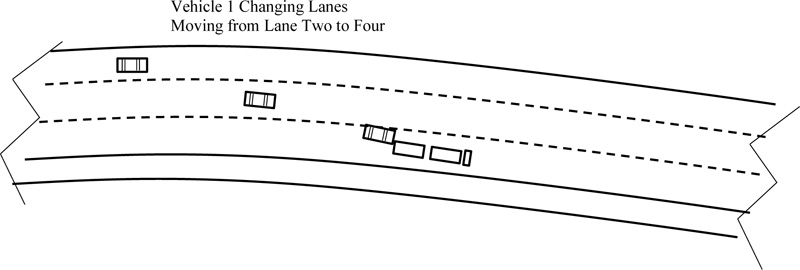
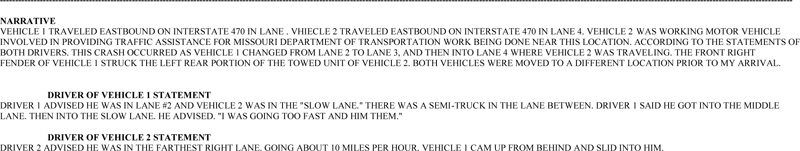
Various Missouri databases were utilized in this research. These databases complemented each other and even provided different perspectives of the same incident by different parties, e.g., police officer, third-party driver, witnesses, DOT driver, DOT supervisor, and DOT scheduler. Scanned paper crash report forms (STARS 2012) [29] from TMA-related crashes were reviewed for 2012 to 2017. Missouri’s crash report form, similar to other states, contains information such as the crash location, vehicle information, driver information, vehicle action/sequence, probable contributory circumstances, collision diagram, and narratives. Fig. (2) shows an example of the collision diagram from a scanned police report. The collision diagram is especially helpful for understanding an incident because it illustrates the setting (i.e.., roadway) along with the action sequence of the various vehicles involved in the incident. Fig. (3) shows an example of the narrative statements provided by the officer and witnesses. b was redacted to remove personally identifiable information from the actual crash report. In reviewing a crash report, all three sections of the report were reviewed: informational fields (approximately 500 fields and checkboxes), collision diagram, and narratives. The information fields can be manipulated digitally, but the collision diagram and narratives need to be reviewed manually. It is important to review all three sections of a report because the sections complement each other, and sometimes one section could contain errors. An example of an error is when the “direction of travel” field is entered incorrectly, it is corrected by the information in the diagram and the narratives.
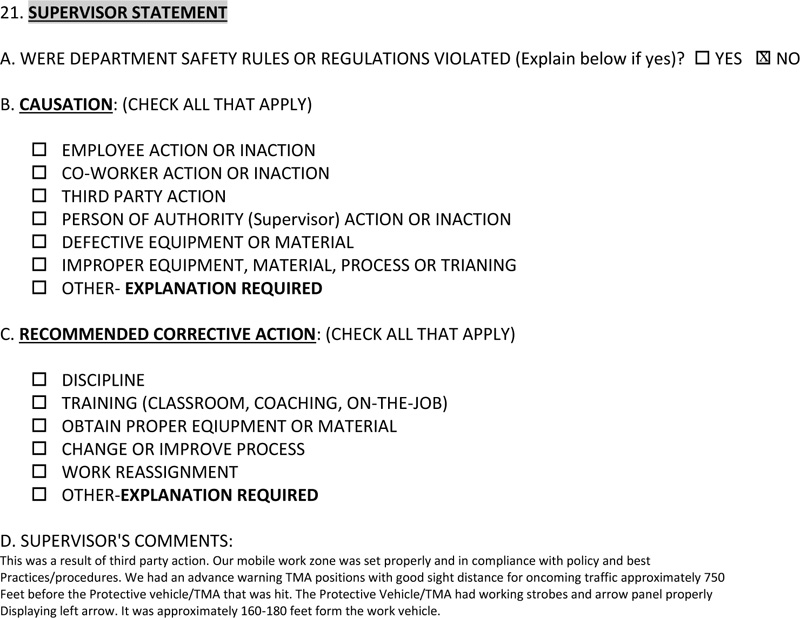
The Missouri Department of Transportation (MoDOT) claim reports were also reviewed for 2012 to 2017. These claim reports had some redundant information with the crash report but included details of DOT operations that were not available elsewhere. Valuable pieces of information included the configuration of the Mobile Work Zone and if proper DOT procedures were followed. Fig. (4), taken from the same incident shown in Fig. (2 and 3), is an example of a snippet from a claim report. As shown in Fig. (4), the claim report presents insights into DOT MWZ operations, including the MWZ setup.
Crash and claim reports did not cover the same crashes, thus these databases were merged to obtain a larger dataset composed of 139 crashes, 117 occurring on MWZs (84%). Ninety-seven percent of the crashes were covered by claim reports, 43.9% were covered by crash reports, and 40% were covered by both claim and crash reports. According to the distribution of road types, 91 of the 117 MWZs crashes occurred on freeways (78%) and only 26 crashes occurred on arterials. From work schedules recorded in 2015-2016, there were a total of 17,498 working days. Out of them, 17,334 belonged to freeways (99.1%).
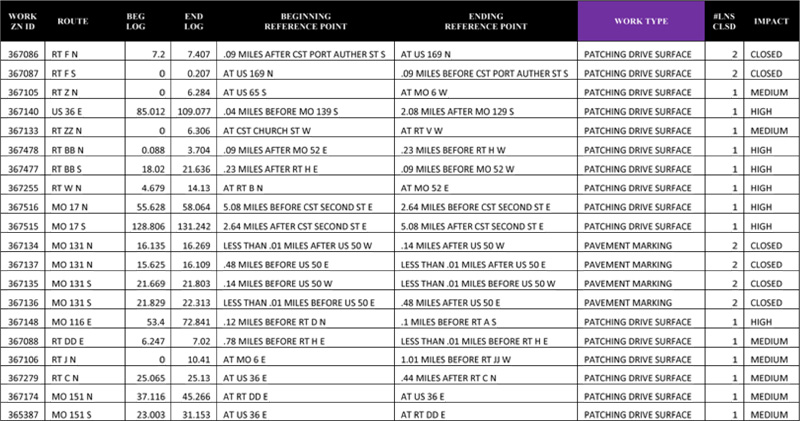
Exposure information is useful in analyzing MWZ incidents by revealing the frequency of MWZ deployment. Fig. (5) is a snippet of the MWZ deployment schedule. The schedule contains information such as the beginning and end mile marker, type of work, number of closed lanes, traffic impact, start and end date, and speed limit. Due to the unavailability of data, TMA deployment schedules for MWZs were only obtained for 2015 and 2016 and for the St. Louis district only. An assumption was made that the MWZ schedule for 2015-2016 from St. Louis applied to the statewide crash data from 2012-2017. This assumption only affected the exposure analysis and not the discussions on the review of the safety data.
The approach undertaken has several advantages and challenges. The use of narratives and diagrams from police responders, witnesses, and DOT staff provides details and confirmation that are lacking in electronic crash databases. However, the review of such data is very labor-intensive and requires the interpretation of narratives. The data fusion approach maximizes the data from various sources, thus augmenting information both qualitatively and quantitatively. But each type of data might not be available for a specific crash leading to crashes having an unbalanced amount of information. The current approach is descriptive in nature, highlighting potential areas of MWZ safety improvement. The lack of statistical modeling, due to the limited amount of data, prevents statistical inference and the estimation of flexibility of various safety-related factors.
The methods used in this study were constrained by the limited TMA crash data available. Even though MWZ crashes are only a small subset of traffic crashes, the large speed differential between the MWZ and approaching traffic along with a concern for worker safety makes it an area of high interest for DOTs. The Missouri data shows that around 50% of the TMA crashes involve injuries or fatalities, which are much higher than the 29% average for all types of crashes in Missouri (Sun et al. 2018) [30]. As a consequence of the limited data, cross-tabulation of the data among various categories and statistical modeling were impractical. Instead, the focus of this paper is on describing the Missouri data and to present some initial results so that other researchers can have a basic understanding of MWZ crashes. In the future, if a more significant dataset could be compiled from several states, if not nationally, then statistical modeling could be feasible. Some inferential statistical techniques were applied in this research. For example, the chi-squared goodness-of-fit test was used to compare the distribution of crashes with the frequency of work zone occurrence by the type of work zone activity (NIST 2012) [31]. This goodness-of-fit test is used to test if two distributions came from the same or different populations.
3. RESULTS
3.1. Initial Impact
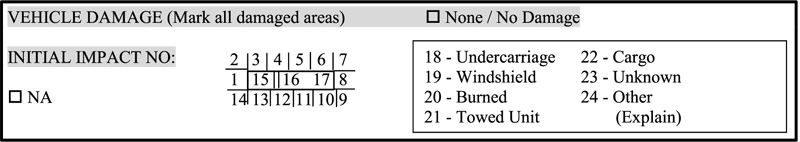
The initial impact is the location where the work vehicle was first contacted during the crash. Fig. (6) shows the numerical codes for completing this field in a crash report. There were two challenges in processing the initial impact data. First, not all crashes contained enough information to determine the first impact. Ideally, this could be ascertained straight from the initial impact code or from a well-drawn police collision diagram along with witness narratives. Second, the location was coded inconsistently by different police officers for TMA crashes. A hit to the TMA trailer could have been coded in three ways: (1) by indicating the contact location (codes 1-14), (2) by indicating that a trailer was hit (code 21), or (3) by indicating “other” to signify the TMA (code 24). Again, crash and claim reports had to be reviewed word to word in order to correct the inconsistent data entry.
In terms of the damage to TMA trucks, there were 51 crashes where the damage location could be ascertained. A common definition for sideswipe (e.g., STARS 2012) [29] is a crash where “the initial engagement does not overlap the corner of either vehicle so that there is no significant involvement of the front or rear surface areas.” In using this definition, 92.2% of the TMA crashes were rear-end crashes and only 5.9% were sideswipe crashes. The percentages do not add up to 100%, as on a rare occasion, the front of the TMA truck could be hit. Some of the rear-end crashes involved vehicles that only contacted a corner of the TMA rear, usually at an angle during lane changing. If such rear-end crashes were moved to a new category representing crashes involving maneuvers from the side, then this new category would report 39.2% crashes and the remaining rear-end crashes would be 58.8%. By looking at the 92.2% result, one might conclude erroneously that most crashes involved a vehicle traveling in the same lane as the TMA truck. In actuality, 39.2% of the crashes involved a vehicle making a lane maneuver. In terms of driver behavior, this leads to the importance of not only slowing down while approaching a Mobile Work Zone but also avoiding lane maneuvers in the vicinity.
3.2. Contributing Factors
Many safety coalitions nationwide focus on the areas of distracted/inattentive, aggressive, and impaired driving. For example, in Missouri, these three categories have been on the top of the safety priority list over the past decade (MCRS 2016) [32]. The same factors also appear to be relevant in the Mobile Work Zone context. Of the 98 crashes, where the reason for the crash could be reasonably ascertained, around 84% of the crashes involved the aforementioned three factors. For some crashes, the reason was unclear due to lack of information or conflicting information, i.e.., the witnesses disagreed. The corresponding percentages for the three factors were 66% for distracted/inattentive, 15% for aggressive, and 2% for poor driving. Other factors besides these three categories include, for example, a work truck backing up or a vehicle being cut off by another vehicle. The high percentage of crashes due to distracted/inattentive driving is unsurprising with the rise of smartphone use while driving and the difficulty in using advanced static warnings for MWZs.
3.3. Employee and Third-Party Action
The examination of employee versus third party actions provides insights into improvements in MWZ policies and procedures. The DOT claim report includes a section where the supervisor discusses the incident. The supervisor reports any safety rule violations by workers, applicable cause(s), recommended corrective action, and a narrative. Examples of causes include third party action, employee or co-worker action/inaction, supervisor action/inaction, equipment, and process. The recommended correction could include training, equipment, process, employee discipline, and work reassignment. Even though the police crash reports do not contain as much insight into employee’s action as the claim report, a crash report was used to confirm the supervisor’s comments from the claim report when both the reports were available for the same incident. Of the 139 crashes, 80% were exclusively the result of third-party action, 8.5% involved some contribution from employees, and 11.5% were unknown. The data shows that the majority of the crashes were the result of third-party actions. Even if employee action was noted (8.5%), the action could involve factors that did not contribute to the cause of the crash, e.g., failure to properly report or document the crash. In summary, MWZ crashes appear to be caused mainly by third-parties; therefore, it would be beneficial to focus countermeasures on improving third-party driver behavior.
3.4. Vehicle Type
The types of vehicles colliding with a TMA were separated into the four categories of passenger vehicles, motorcycles, buses, and commercial trucks. An additional category of “missing” involves crashes with an unknown vehicle type, mainly due to missing police crash reports. The passenger vehicle category includes subcategories such as sedans, pickup trucks, and minivans. Commercial trucks refer to trucks that require a commercial vehicle license, including single unit trucks, dump trucks, and tractor-trailers. Of the 131 recorded crashes, 77% involved passenger vehicles, but 14.5% involved commercial trucks. There was only one instance of a bus and a motorcycle crash. It was not feasible to determine if the percentage of truck crashes is representative of the percentage of trucks traveling on facilities where the crashes occurred. This is because truck percentages differ significantly by the time of the day, and traffic volume by the type of vehicle is not available for the facilities in question. Nonetheless, the significant percentage of commercial truck crashes means that it would be beneficial to invest on truck safety for MWZs. In contrast to driving passenger vehicles, commercial driving is highly regulated, affecting issues such as training, licensing, operating hours, and driving logs. These additional issues could be avenues for improving MWZ safety for commercial trucks.
3.5. Work Zone Activity
As discussed in Material and Methods, there were several challenges to the quality and availability of work zone activity information in the crash, claim, and schedule databases. Despite these challenges, several observations could be made by comparing work zone crash data with work zone schedule data. Table 1 shows the five frequently occurring types of work activities in MWZs. The average, median, and standard deviation refers to the segment length of the MWZs. The number of observations correlates with the number of MWZs. Even though all MWZs are similar in not occurring at a fixed location, there are a number of differences. Patching and pot hole filling involve crews stopping for a brief period of time to patch and then moving to the next spot. Striping, sweeping, and marking involve continuous work at slow speeds (e.g. 10 mph). The speed of operation, for example, for striping, depends on many factors such as the types of paint and environmental conditions. Mowing activity could involve the mower being driven on the shoulder and the shadow crew even encroaching on travel lanes. It is unsurprising then that the frequency of crashes differs among the different types of work zone activities. Table 1 compares the frequency of work activity versus the frequency of MWZ crashes. These two distributions are statistically different, according to the Chi-Squared distributional test (p-value << 0.01).
The exposure to risk in MWZs depends on several factors, including the length of segment, duration, continuously moving versus stopping intermittently, speed of operation, and location of work. It is difficult to control for all these factors when considering both the crash frequency and the exposure rate. However, some preliminary conclusions can be made using the results shown in Table 1. First, the fact that patching has the highest crash frequency of 13.1% does not mean that this type of work is overrepresented in light of the high frequency of occurrence (79.2%) and the average length of work zone (7.13 mi). Second, similar reasoning applies to the second highest crash frequency of striping (12.3%), which has the longest segment lengths per deployment. However, sweeping appears to be overrepresented, accounting for 10.8% of crashes while only having 3.2% of MWZ frequency. Despite the many uncertainties in understanding the data, one conclusion is that all the five aforementioned types of work resulted in MWZ crashes, and that, at this point, there does not appear to be any type of work that is extraordinary in terms of risk. An approach to improving safety would then involve looking at all of these types of work zones together and devising countermeasures that apply to all.
3.6. Seasonality
Both the transportation demand and supply system change throughout the year due to various factors (Memmott and Young 2017) [33]. Weather conditions, especially during the winter season with snow and ice, negatively impact road surfaces and travel demand. Summer vacation and holidays generate discretionary passenger travel while factory production and consumer demand generate freight volume. Seasonality also affects MWZ schedules for the different types of mobile work. For example, there is a greater demand for mowing during spring and fall. There is also great demand for patching in the spring after winter snow plow operations and salting operations have resulted in various types of pavement distress. Striping requires certain temperature ranges in order for paint to properly adhere and dry. The examination of MWZ crashes by month of the year reflects the various aforementioned changes in travel demand. Table 2 shows the crash frequency by month and the frequency of Mobile Work Zone deployment by month. In order to utilize statistical testing, the crash and work frequency by month were converted into distributions. In other words, the percentage of crash and work occurrence were computed for each month. Table 2 reveals that the distribution for MWZ crashes is different than the distribution for MWZ deployments. A chi-squared distributional test measured a p-value of 0, meaning the distributional differences between crashes and deployments were statistically significant. A clear distributional shift is seen, where the crashes were shifted towards earlier in the year. Of note are March and April with significant increases and June, August, and September with significant decreases. One possible explanation is that the traveling public is less mindful of work zones early in the construction season but become more vigilant once exposed to more work zones.
Table 1.
| Moving Work Zone Types | Average (mi.) |
Median (mi.) |
Std.Dev. (mi.) |
Obs. | % | Crash % |
|---|---|---|---|---|---|---|
| Patching Drive Surface | 7.13 | 5.64 | 5.90 | 3,613 | 79.2 | 13.1 |
| Pavement Striping | 12.01 | 7.72 | 12.67 | 432 | 9.5 | 12.3 |
| Sweeping Pavement | 7.90 | 6.97 | 5.77 | 148 | 3.2 | 10.8 |
| Pavement Marking | 3.37 | 1.55 | 6.98 | 227 | 5.0 | 0.8 |
| Mowing | 8.02 | 5.62 | 8.87 | 144 | 3.2 | 5.4 |
| Month | Crashes | Working schedules | Difference | ||
|---|---|---|---|---|---|
| Frequency | % | Days | % | % | |
| Jan | 5 | 5.49 | 280 | 1.62 | 3.87 |
| Feb | 5 | 5.49 | 261 | 1.51 | 3.98 |
| Mar | 14 | 15.38 | 678 | 3.91 | 11.47 |
| Apr | 14 | 15.38 | 884 | 5.1 | 10.28 |
| May | 7 | 7.69 | 1633 | 9.42 | -1.73 |
| Jun | 6 | 6.59 | 2783 | 16.06 | -9.47 |
| Jul | 11 | 12.09 | 2743 | 15.82 | -3.73 |
| Aug | 6 | 6.59 | 2857 | 16.48 | -9.89 |
| Sep | 5 | 5.49 | 3012 | 17.38 | -11.89 |
| Oct | 7 | 7.69 | 1540 | 8.88 | -1.19 |
| Nov | 5 | 5.49 | 478 | 2.76 | 2.73 |
| Dec | 6 | 6.59 | 185 | 1.07 | 5.52 |
| Total | 91 | 100 | 17334 | 100 | |
| Speed Limit | Crash % | Work % |
|---|---|---|
| 70 | 18.8% | 1.3 |
| 65 | 19.5% | 1.3 |
| 60 | 36.8% | 1.0 |
| 55 or under | 24.8% | 96.4 |
3.7. Speed Limit
The frequency of crashes was examined in relation to the speed limit of the facility. Table 3 shows the crash frequency and frequency of MWZs by speed limit. The higher speed limit facilities result in the majority of crashes, with a speed limit greater than 60 mph accounting for over 75%. At the same time, these higher speed limit facilities were only 3.6% of the MWZs scheduled. Exposure factors for MWZs include the frequency of work zones, the length of work zones, and the amount of traffic. The amount of traffic could partially explain the higher crash frequency in higher speed facilities, as such facilities are high volume facilities, such as freeways and expressways. No quantitative analysis was conducted on traffic volume since lower speed limit facilities often lacked traffic volume information. But work zone length was not a factor as there was very little correlation between the speed limit and the length of MWZ (r = 0.085). A physical explanation for the overrepresentation of MWZ crashes in high-speed facilities is the longer stopping sight distance required and the greater speed differential between MWZ and approaching traffic. The speed limit results point to the need to focus MWZ safety efforts on high-speed facilities.
3.8. Time of Day
The Time Of Day (TOD) of MWZ crashes is not informative as it reflects DOT scheduling practices to minimize traffic impacts and to utilize daylight. MoDOT, like other DOTs, has a policy of minimizing traffic impacts; thus, peak periods are mostly avoided. Also, night time work is rarely performed. In addition, work zone schedules do not contain active hours, only start and end dates. Even MWZ dates are not completely accurate as schedules are often updated based on weather and progress.
3.9. Collision Lane
The lane in which a collision occurred was separated into three categories of leftmost, rightmost, and middle. There were 54 crashes in the leftmost lane, 31 crashes in the middle lanes, and 55 crashes in the rightmost lanes. There was no lane information in the work activity database; therefore, there was no direct exposure data indicating if work went on more often on the leftmost versus the rightmost lane. The crash data, balanced between leftmost and rightmost lanes, is some indication that there is not a disparity between the rightmost and leftmost lanes.
3.10. Colliding TMA Truck
MWZs could involve one or more TMA trucks depending on the type of work and the type of transportation facility. The TMA vehicle impacted was categorized into the following classes: shoulder, rear advanced, middle advance, and front TMA truck. An additional category represents work trucks being hit. As expected, the vehicle hit most often (65.5%) is the rear advance truck, which is the first protective vehicle in the lane of work encountered by an approaching vehicle. Of interest is the second most frequent category, the middle advance (21.8%). These crashes occur because drivers switch back to the work lane despite having just passed the rear advance TMA. Recall, the initial impact location analysis showed that 39.2% of crashes involved lane maneuvers. One consequence of these results is that just a warning of the presence of the MWZ is not enough. There is evidence of drivers’ confusion while traveling in parallel with the work train (the series of work and protective vehicles). The frequency of occurrence for the other categories is 8% for shoulder, 2.3% for front, and 2.3% for work.
4. DISCUSSION
In results, the effects of various variables on MWZ crash frequency are discussed for each variable in isolation. Here, the most salient results are summarized and the combined effects of the various results are discussed. Future directions for research are also presented.
Several results point to the importance of focusing on driving behavior near Mobile Work Zones. In terms of fault, a large percentage of the crashes (> 80%) were due to third party fault. Major driver behavior factors in crashes include distracted/inattentive (66%) and aggressive (15%) driving. Crashes occurred frequently in the spring, possibly due to drivers needing to adjust to a new construction season. These results point to the need for policies and regulations that emphasize the need for drivers to be vigilant and not be surprised by MWZs. Over the years, many policies addressed those areas. Enforcement and increased penalties in work zones serve to encourage safer driving. However, MWZs are difficult to enforce. Public outreach and education are important for informing and reminding the drivers. Perhaps, the messaging to the public could emphasize the fact that MWZs could appear with little advanced warning in contrast to static work zones.
Continuing with the theme of driver behavior, there was a significant percentage of crashes (39.2%) related to lane changes, i.e.. impact on the side or the corner. This was also born out in the specific vehicle of the work train that was hit. Despite the rear advance TMA being hit the most often (65.5%), there was also a significant percentage (21.8%) of middle advance TMAs being hit. Therefore, the problem is not only with the approach to the MWZ, but also with traversing the MWZ. The lane-change related crashes point to confusion and aggressive driving after passing the rear advance TMA truck. In addition to the aforementioned ways of improving driving behavior via education and enforcement, there could be procedures and technologies that could help to improve driver comprehension while traveling through MWZs. Perhaps there could be additions or changes to the MUTCD configurations that could clarify to the driving public of the entire work train operating as an integrated unit. In other words, the goal is to have drivers who mentally link the vehicles in the work train, i.e.. the various protective and work trucks, and not be tempted to use gaps in the work rain.
Some results relate to the coupling of the facility type with driving behavior. Higher speed limit facilities (>60 mph) were overrepresented, accounting for over 75% of crashes. And aggressive driving accounted for 15% of crashes. The limited perception/reaction times in high-speed facilities present a great challenge for safety improvements. Perhaps the potential wave of connected and autonomous vehicle technologies can address this difficult problem. In-vehicle warning systems equipped with LiDAR could eliminate the decision lag resulting from human perception/reaction. In the future, MWZs could emit warning beacons communicating location, speed, and work train information.
In terms of work activity, patching was not necessarily overrepresented, having the highest percentage of crashes at 13.3%, since patching dominated work activities (79.2%). Sweeping appears to standout with 10.8% of crashes with only 3.2% of occurrences. It is unclear why sweeping operations would be unique, given the fact that sweeping equipment does not appear to be any more problematic than striping and mowing equipment.
Several theoretical applications follow from these findings. One is to create a short informative video for the public on MWZ characteristics and how to behave near them. This video could highlight several MWZ issues. First, the video could note the issue of differential speeds when traffic approaches the end of a moving work zone. Second, corresponding to middle advance TMA hits, the video could describe typical work trains and emphasize the importance of not cutting in between work vehicles. These videos should focus on facilities with threshold speeds of at least 50 miles per hour where the issue of speed differential is magnified. These videos should be highly publicized via mass media and DOT social media just before the onset of the construction season. Another theoretical application is to promote Mobile Work Zone enforcement. Several publications have discussed the use and effectiveness of work zone enforcement [16, 34-41]. Approaches to work zone enforcement include manual stationary/passive, active (i.e.. mobile/circulating, aerial, and pack), and automated. An active trailing approach would result in the police complementing traffic control devices to warn drivers of approaching work zones. On the other hand, a downstream police vehicle could be effective in active pursuit of vehicles speeding through a MWZ. The threshold for deploying MWZ enforcement depends on the potential safety impacts, the amount of traffic, and the enforcement budget. A speed limit threshold could be a 30 mph difference between the speed limit and the work speed (e.g. 50 mph – 20 mph).
One significant impediment to research into MWZ safety is the incompleteness and paucity of data. As discussed in this paper, data problems exist for all related databases including crash, claim, and work zone. The quality of crash data varies among the reporting police agencies. Some agencies make computer-aided drawings while some still do it manually. Even fields that have a fixed number of choices, e.g. first impact location, were recorded differently. Claim reports offer additional insights into DOT operations but are hand-written and hand-drawn. Only a limited number of incidents have both the crash and claim reports. Accurate work zone information is a challenge because what is scheduled is often not implemented due to changes in weather, work progress, or other circumstances. MWZs are dynamic both temporally and spatially. MWZ records are not centralized so each district maintains its own records. The lack of data prevented the researchers from performing statistical modeling and using more advanced techniques for statistical inference.
CONCLUSION
Assuming that a more significant MWZ dataset could be developed, perhaps by gathering data from multiple states, then several practical research directions could be pursued. First, modeling of MWZ crashes and/or severity could be conducted. One type of model is the Safety Performance Function (SPF), as promoted in the Highway Safety Manual, that predicts the number of MWZ crashes given certain variables of exposure (e.g., Claros et al. 2018) [42-46]. Another type of model estimates the crash severities, including fatal and severe crashes. Complementing SPF development is the derivation of Crash Modification Factors (CMFs) for MWZs. This research built a foundation for future MWZ research, for example by describing some of the important variables and their impact on countermeasures, so that with the availability of improved data, more advanced research could be conducted. It was important to start analyzing MWZs, despite the data challenges, as the problem of driver inattention appears to be exacerbated by the rise in the use of technologies, such as smart phones.
CONSENT FOR PUBLICATION
Not applicable.
AVAILABILITY OF DATA AND MATERIALS
The data used in this research cannot be shared by the authors as the authors do not own the data. Instead, interested parties should contact Missouri State Highway Patrol and Missouri Department of Transportation for the data for their permission.
FUNDING
None.
CONFLICT OF INTEREST
The authors declare no conflict of interest, financial or otherwise.
ACKNOWLEDGEMENTS
The authors would like to thank the assistance provided by the Missouri Department of Transportation (MoDOT). Nickolas Voltenburg, Jennifer Harper, Daniel Smith, Myrna Tucker, Darrell Knierim, and other staff from MoDOT have been invaluable in providing the various data sources. The contents of this paper reflect only the views of the authors who are responsible for the facts and the accuracy of the results presented herein.

