All published articles of this journal are available on ScienceDirect.

The Energy Consumption of Passenger Vehicles in a Transformed Mobility System with Autonomous, Shared and Fit-For-Purpose Electric Vehicles in the Netherlands
Abstract
Aims:
This article explores the tank-to-wheel energy consumption of passenger transport at full adoption of fit-for-purpose shared and autonomous electric vehicles.
Background:
The energy consumption of passenger transport is increasing every year. Electrification of vehicles reduces their energy consumption significantly but is not the only disruptive trend in mobility. Shared fleets and autonomous driving are also expected to have large impacts and lead to fleets with one-person fit-for-purpose vehicles. The energy consumption of passenger transport in such scenarios is rarely discussed and we have not yet seen attempts to quantify it.
Objective:
The objective of this study is to quantify the tank-to-wheel energy consumption of passenger transport when the vehicle fleet is comprised of shared autonomous and electric fit-for-purpose vehicles and where cheap and accessible mobility leads to significantly increased mobility demand.
Methodology:
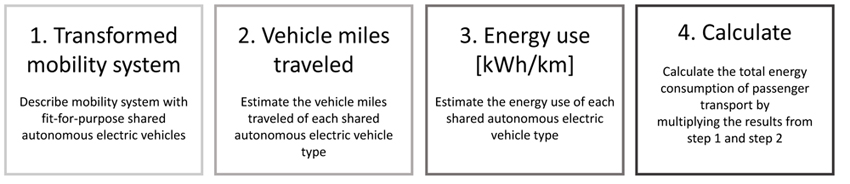
The approach consists of four steps. First, describing the key characteristics of a future mobility system with fit-for-purpose shared autonomous electric vehicles. Second, estimating the vehicle miles traveled in such a scenario. Third, estimating the energy use of the fit-for-purpose vehicles. And last, multiplying the mileages and energy consumptions of the vehicles and scaling the results with the population of the Netherlands.
Results:
Our findings show that the daily tank-to-wheel energy consumption from Dutch passenger transport in full adoption scenarios of shared autonomous electric vehicles ranges from 700 Wh to 2200 Wh per capita. This implies a reduction of 90% to 70% compared to the current situation.
Conclusion:
Full adoption of shared autonomous electric vehicles could increase the vehicle-miles-travelled and thus energy use of passenger transport by 30% to 150%. Electrification of vehicles reduces energy consumption by 75%. Autonomous driving has the potential of reducing the energy consumption by up to 40% and implementing one-person fit-for-purpose vehicles by another 50% to 60%. For our case study of the Netherlands, this means that the current 600 TJ/day that is consumed by passenger vehicles will be reduced to about 50 to 150 TJ/day at full adoption of SAEVs.
1. INTRODUCTION
Greenhouse Gas (GHG) emissions from the transportation sector are increasing on a yearly basis [1]. This trend is likely to continue with the projected increases in passenger-miles-travelled up to 2050 [2]. In 2018, passenger vehicles consumed 116 PJ globally and were accountable for 9.5% of the global CO2 emissions [2, 3]. To decarbonize transportation and reduce its environmental impact, the sector requires radical changes.
The transformational potential of autonomous and electric vehicles in the mobility sector are widely recognized, see for instance [4–11]. Automation of vehicles and significantly reduced costs per kilometer can lead to shared vehicle fleets that provide mobility as a service (MAAS) with high utility, high flexibility, and at low costs [12–15]. This could realize the transformational shift from CO2 emitting privately owned vehicles to fit-for-purpose shared autonomous electric vehicles.
Adoption of electric drivetrains can reduce the GHG emissions per vehicle kilometer by 50% to 78%, depending on the energy mix [16–18]. However, if mobility becomes more attractive and accessible, the mobility demand could significantly increase. Not only due to increased usage from the current users, but also due to entrance of new user groups for passenger mobility, such as children, elderly and disabled, and modal shifts [4, 19–22]. Besides higher mobility demand, increased driving speeds of autonomous vehicles and additional onboard computing could increase the energy consumption of vehicles per kilometer [23]. On the other side, there are several aspects of Shared Autonomous Electric Vehicles (SAEVs) that could greatly reduce the energy consumption of vehicles. In a mobility system with SAEVs, optimization of vehicle assets and cost-based preferences of consumers could drive the mobility market towards fit-for-purpose vehicles. Such vehicles, which could predominantly be one-person vehicles, would be significantly more aerodynamic, smaller, lighter, cheaper, and energy efficient than current privately owned vehicles [21, 24].
Adoption of shared autonomous electric vehicles, the accompanying technologies, legislative frameworks and consumer behavior are still highly speculative. That makes it difficult to assess the net effects of the potential mobility transformation on the energy consumption of passenger transport. Ross and Guhathakurta compared several researches on the topic and found a spread of 50% decrease to 100% increase of the energy consumption of passenger transport with shared autonomous (electric) vehicles [9]. However, most of these studies did not look beyond the current mobility demand and current day passenger vehicles. This paper distinguishes itself by exploring the tank-to-wheel energy consumption of passenger vehicles in a completely transformed mobility system. A mobility system with mainly fit-for-purpose (one-person), shared, autonomous, and electric vehicles that also improves the livability of urban environments (section 3.1.1).
To explore the tank-to-wheel energy consumption in such transformed scenarios, the next section first shows that existing literature focuses on current mobility systems rather than implementing transformative aspects in their analyses. After that, the transformed mobility system is discussed and the energy consumption and vehicle miles traveled of different types of fit-for-purpose vehicles in such systems are estimated. In the result section, the tank-to-wheel energy consumptions per capita are calculated in a high and a low scenario. The findings are also applied to the case study of the Netherlands. The discussion goes into implications, limitations and future research. Finally, the conclusion summarizes the findings of this paper.
2. OVERVIEW OF ENERGY CONSUMPTION OF ELECTRIC VEHICLES
This section provides an overview of the most relevant literature regarding the energy consumption of (shared) autonomous (electric) vehicles and the broad range of outcomes it produces.
Wadud et al. [21] identified specific mechanisms of autonomous driving that will affect the energy consumption of passenger transport. The energy reducing mechanisms were vehicle right-sizing, platooning, eco-driving, crash avoidance, de-emphasized performance, changed mobility services and congestion mitigation. On the other side, they identified increased driving speeds, increased computing features and induced demand as mechanisms that could increase energy consumption. The authors quantify the high and low ends of these mechanisms for the mobility system in the U.S. and define four scenarios. They conclude that full adoption of autonomous vehicles may, depending on the scenario, nearly half, or almost double the energy consumption of passenger transport in total. A switch from internal combustion to electric drivetrains was excluded in this study. Chen et al. [25] used the results of Wadud et al. to model the impact of autonomous vehicles on U.S. fuel consumption with a stock model. They concluded that passenger transport fuel consumption either increases by 30% in the most pessimistic scenario or decreases by 45% in the most optimistic scenario. Stephens et al. [26] found similar results. They estimated fuel use and consumer costs of automated and connected vehicles and found that the final energy consumption in passenger transport either reduces by 64% or increases 194%.
Greenblatt and Saxena [24] looked at how autonomous electric ride-sharing taxis could reduce GHG emissions of light-duty vehicles in the U.S. They found that 87% to 95% of the GHG emissions could be saved compared to internal combustion engine taxi’s. Moriarty and Wang [3] discussed the potential of autonomous vehicles to reduce transport energy consumption from a perspective of the likelihood of adoption. They conclude that autonomous vehicles will at best slightly decrease transport energy consumption and GHG emissions because they are much more likely to fill niche markets than to reach mass adoption. According to the authors, safety concerns, such as hackers and terrorist attacks, and ethical issues prevent fast and full adoption of autonomous vehicles. Assuming gradual autonomous vehicles adoption over 30 years, they also doubt the significance of reduced GHG emissions, as it would be too late. Finally, they state that autonomous vehicles are unlikely to become smaller than current vehicles as they will also function as work spaces and entertainment centres.
Liu et al. [23] also explored the potential of autonomous driving to reduce greenhouse gas emissions. They distinguished between traffic related influences (eco-driving, less congestions, etc.) and vehicle related influences (changes in vehicles weight, on-board energy use, etc.). They claim that adding exterior supportive attributes for autonomous driving could result in additional aerodynamic resistance that will lead to an increase in fuel consumption of 2%, and adding about 1.5% of weight. Right-sizing and one-person vehicles were shortly mentioned, however, they did not investigate the radical changes that could come about when replacing five-person vehicles with single-person vehicles for most trips. They applied a stock model to determine the share of autonomous electric vehicles in the vehicle mix, their mileage and their fuel consumption. About 95% of the autonomous vehicles in their analysis were privately owned multi-person vehicles.
To summarize, existing scientific literature lacks an exploration of mobility systems transformed by fit-for-purpose shared autonomous electric vehicles and where new forms of mobility demand are induced.
3. METHODOLOGY, SCENARIO DESCRIPTION AND ESTIMATIONS
The tank-to-wheel energy consumption of passenger mobility with shared autonomous electric vehicles is estimated with the four-step approach of Fig. (1). In the first step, the transformative characteristics of mobility systems with full adoption of fit-for-purpose shared autonomous electric vehicles are discussed. In the second step, the vehicle miles traveled of different vehicle types in such a mobility system are estimated. For this, simulation results of our previous research on fleet dynamics of shared autonomous electric vehicles [27] are used. Next, the energy use of the vehicles is estimated based on state-of-the-art vehicles with similarities to fit-for-purpose autonomous and electric vehicles. And in the final step, the vehicle miles traveled of a population is, per vehicle type, multiplied with the corresponding energy consumption. The following subsections elaborate on step one to step three. The final step leads to the results and is shown in the result section.
3.1. A Mobility System with Fit-For-Purpose Shared Autonomous Electric Vehicles
By its very nature, scenarios with fit-for-purpose Shared Autonomous Electric Vehicles (SAEVs) are highly speculative. But in the explorative perspective of this paper, they provide fast, safe and comfortable personal transportation for the whole population, while travellers can use their travel time for anything they deem fit. The hassles of walking to the vehicle, finding a parking space, pay for parking, waiting for public transport, and transfers are all eliminated in the mobility as a service system. In cities, most vehicles that fit your specific trip are summoned within minutes with a single touch on your smartphone. In rural areas, a bit more planning of trips is practical because less dense shared fleets will have longer waiting times. Being tired or influenced by medication or alcohol will pose no problem to using passenger vehicles. The transformative aspects of such a mobility system are described below.
3.1.1. Better Living Environments
Shared autonomous electric vehicles do not require traffic signs and parking spaces in city centres. This opens up public space and turns urban areas into safer, broader and greener environments. Smooth traffic and platooning solve congestion issues while requiring fewer roads than the current system. Small and driverless vehicles are safe for playing kids and pedestrians. Particulate matter emissions and noise are related to vehicle size and thus cities are healthier and more comfortable.
3.1.2. Fit-For-Purpose Vehicles
The sharing and autonomous aspects of shared autonomous electric vehicles significantly strengthen the idea of fit-for-purpose vehicles. Currently, families choose a private car that is able to fulfil most of their travel needs. A conventional car is the optimal choice in that case. But this equation changes when a single person chooses an optimal vehicle for a single trip. For most trips (e.g., commutes) only one person would need to be accommodated and luggage space needs would be limited. Also, SAEVs do not require long range or high speeds for a large part of the trips [27]. Since costs increase with size, weight and top speed, smaller and cheaper vehicles are a likely fit-for-purpose choice for travellers in many cases. City authorities looking for a safe, healthy and spacious city further improve the business case of fit-for-purpose vehicles by giving them access to more areas of the city than larger vehicles.
3.1.3. Types of Shared Autonomous Electric Vehicles
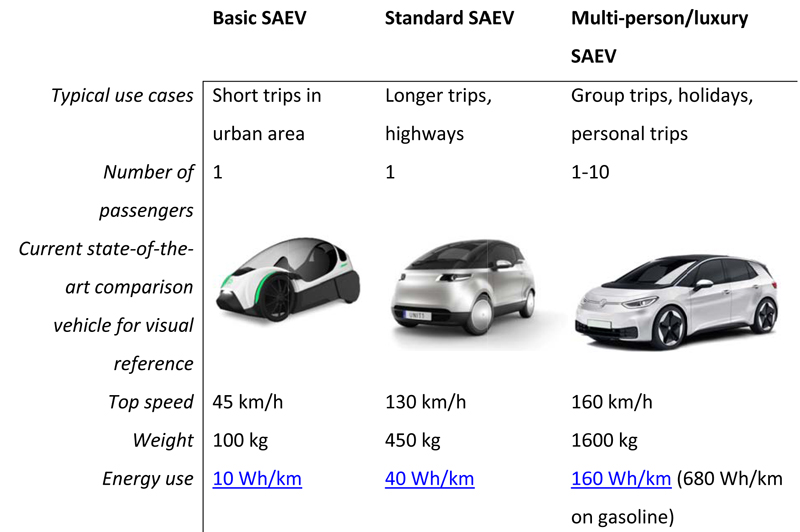
Single-person short trips, such as for shopping, school, and doing sports, could largely be performed with one-person vehicles that require little power, luxury and luggage space. But any specific need for a trip could be requested from the vehicle fleet. Long distance trips or trips over the highway, require the shared autonomous electric vehicle to be able to travel at high speeds, which will increase their cost and energy consumption. However, long distance trips with one person still require significantly less weight and size than a regular car. Finally, there will be demand for multi-person vehicles and for more extravagant vehicles. For example, trips to school with multiple children, group-trips, family holidays, business meetings, et cetera.
Fig. (2) provides example characteristics of three shared autonomous electric vehicles types based on the above perspective; a basic SAEV for the short local trips, a more potent standard SAEV or highway trips, and a multi-person/luxury SAEV. Although the diversification of the SAEV fleet will be richer in reality, these three simple options could provide some useful insights into the energy use of passenger transport with SAEVs.
3.1.4. Induced Mobility Demand
Functional, cheap and sustainable mobility leads to an increase in mobility demand [4]. It causes modal shifts from other modalities, such as biking and public transport, towards SAEVs. Secondly, people will make more and longer trips. Thirdly, new user groups such as the elderly and children gain access to passenger vehicles. And finally, additional mileage has to be made by SAEVs for charging, parking, picking up passengers and redistribution of vehicles to prepare for the expected demand.
3.2. Vehicle Miles Traveled Estimations
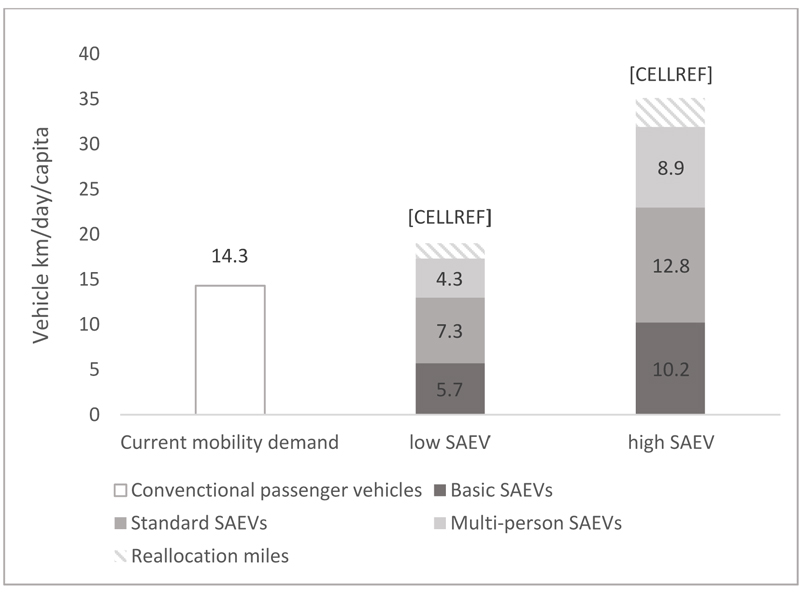
The previous section defined the perspective of the transformed mobility system, the next step is to estimate the vehicle miles traveled of such a society. For these estimations, the simulations results of [27] are used explored fleet dynamics of the same future mobility system as described in the first step [27]. The resulting vehicle-miles-travelled per capita are shown in Fig. (3). A low SAEV scenario, with relatively limited induced mobility demand, and a high SAEV scenario, with a lot of additional mobility demand, are defined [27]. The same mobility demand scenarios are used in this research. Currently, the total mileage per capita in the Netherlands is about 14.3 km/day. In the low SAEV scenario, this increases to 19.0 km/day, while in the high SAEV scenario it increases to 35.1 km/day.
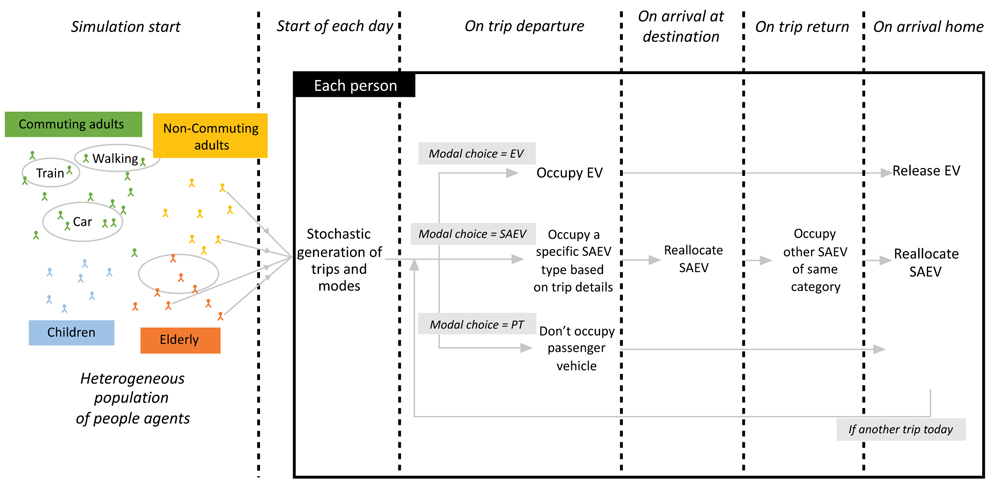
Hogeveen et al. generated these results by simulating daily trip patterns with shared autonomous electric vehicles of heterogeneous people-agents [27]. The trip patterns were based on Dutch mobility statistics and a high and a low induced demand scenario. The Dutch mobility statistics include departure times, trip distances, driving speeds, and trip frequencies per age group and per modality. The induced demand from SAEVs included a percentage of public transport trips shifted to SAEVs, additional mileages per trip, additional trips, reallocation of SAEVs after trips, and new user groups (like children going to school with SAEVs). Each trip in the SAEV scenarios is simulated with either a basic, a standard or a multi-person SAEV. Generally speaking, short trips and trips made by children are made with basic SAEVs and longer trips are made with standard SAEVs. All adult trips have a probability to be made with a multi-person SAEV.
Fig. (4) provides a conceptual overview of the model, A more elaborate description, including the modelling approach, the data used, and scenario parametrization can be found in [27]. Fig. (4) shows that the model creates a heterogeneous agent-population in which each person has their own travel characteristics. People-agents probabilistically set their daily trip schedule at the start of each day. This includes modalities, distances, number of trips, etc. As a day is simulated, the people-agents follow their trips patterns through a state diagram. The model does not contain geographical dynamics, instead reallocation of vehicles is modelled by adding additional occupancy and mileage of an SAEV after passenger drop off. Martinez and Viegas [28] researched the geographical aspects of this and concluded about 10% additional mileage for reallocation. Their findings are applied in this research.
3.3. Energy use Estimations for Fit-for-Purpose Shared Autonomous Electric Vehicles
After estimating the vehicle miles traveled with SAEVs, an estimation of the energy use of the vehicles is required. The impacts on the vehicle energy use of electrification, fit-for-purpose, and autonomous driving are subsequently discussed in the following subsections.
3.3.1. Electrification
The first major difference between the energy use of a fleet of SAEVs and the current situation is electrification. The average energy use of new cars sold in Europe in 2018 was 73 kWh/100km [29] and the energy use of the most popular car, the Volkswagen Golf, was 68 kWh/km according to the EPA [30]. Therefore, the electric version of this car, the Volkswagen e-Golf, was taken as the benchmark for the multi-purpose SAEV. Averaging road testing (17 kWh/100 km [29]) and EPA testing (15 kWh/100km [30]) lead to energy use for this vehicle of 16 kWh/100km. This means a reduction in energy consumption from electrification of about 75%. To account for charging losses and additional 8% is applied to the SAEV’s energy consumption.
3.3.2. Fit-For-Purpose Vehicles
The standard one-person vehicle defined in section 3.1.3 is a single seater with a high level of safety and a top speed of at least 130 km/h. Unfortunately, no vehicles fitting this description exist at the time of writing. Comparable (prototype) vehicles that do exist are two person tandem seaters like the Peraves Monotracer (315 km/h, 385 kg, 11 kWh/100km), the Volkswagen L1 (158 km/h, 290 kg, 2.4 kWh/100km) and Unity One (130 km/h, 600 kg, 8 kWh/100km). From this wide range in terms of energy use, a one seater without an internal combustion engine is probably on the lower side, if not lower, of that spectrum. As such 4 kWh/100km is used for the standard SAEV.
The basic one-person SAEV is meant for short city-trips. For such a vehicle, a top speed of 60 km/h is assumed, similar to an electric bike or scooter but with a comfortable chair and protection against rain, wind and traffic accidents. Examples of electric (pedal-assist) bikes with four wheels are the Velomobiel Quatrovelo (35 kg, 0.5 kWh/100km) and the Podbike (65 kg, 0.5 kWh/100km). An example of a tandem-seated 45km/h scooter with a full roll cage is the Carver (260 kg, 5 kWh/100km). The concept of the Podbike is used as a benchmark of a vehicle that is both energy efficient and optimally suited when taking liveability of cities into account. However, because the Podbike is pedal assisted and the top speed of 60 km/hr can only be achieved downhill, energy consumption of 1 kWh/100 km is used for basic SAEVs instead of the 0.5 kWh/100 km of the Podbike.
Multi-person shared autonomous electric vehicles are similar in size and utility to current family-sized vehicles. As such, the energy use of 16 kWh/100 km from section 3.3.1 is used for the multi-person SAEVs.
3.3.3. Autonomous Driving
Liu et al. [23] reviewed recent literature on the effects of autonomous driving with regards to fuel consumption. For the net cumulative effects of eco-driving, smoothening traffic, crash avoidance, and higher driving speeds they found a range of 4% increase in fuel consumption to 32% reduction in fuel consumption [23]. Platooning with autonomous vehicles could lead to yet another increase in energy efficiency, this effect would be most apparent on highways, where driving speeds are relatively high. For trucks, research indicates a potential reduction in energy consumption of 4% to 10% as a result of platooning [31, 32]. The benefits of platooning for fit-for-purpose passenger vehicles is probably lower due to the small and, most likely, already aerodynamic efficient design of such vehicles. To keep things simple, a 4% to 8% energy use reduction from platooning is taken into account. Adding this to the findings of [28], the total estimated energy savings from automation ranges from 0% to 40%. Note that these numbers are based on the literature reviews from [23, 31, 32].
4. CALCULATING THE TANK-TO-WHEEL ENERGY CONSUMPTION OF FUTURE PASSENGER VEHICLES
The previous section explored the energy consumption and the vehicle miles traveled per capita (in a low and a high scenario) of three categories of shared autonomous electric vehicles that could form the basis of our future mobility system. Here, the mileages per vehicle category are multiplied with their respective energy consumption to obtain the tank-to-wheel energy use per capita in the Netherlands at full adoption of SAEVs in the two scenarios. Table 1 shows the resulting numbers. For the scenario where the induced mobility demand is relatively low, the low SAEV scenario, the tank-to-wheel energy consumption per capita is estimated at about 700 to 1100 Wh/day, depending on the energy savings from autonomous driving. For the scenario that includes a massive expansion of mobility use, the high SAEV scenario, the tank-to-wheel energy consumption per capita ranges from 1300 to 2200 Wh/capita/day. As discussed in section 3, reallocation miles, such as driving to overnight depots or picking up a distant passenger, are already included in these numbers.
| - | Basic SAEVs |
Standard SAEVs | Multi-person SAEVs | Total |
|---|---|---|---|---|
| Energy efficiency estimate [Wh/ km] | 10 | 40 | 160 | - |
| Low SAEV scenario | - | - | - | - |
| Vehicle-miles-travelled [km/capita/day] | 6 | 8 | 5 | 19 |
| Consumption with 0% AD savings* [Wh/capita/day] | 63 | 321 | 757 | 1141 |
| Consumption with 40% AD savings* [Wh/capita/day] | 38 | 193 | 454 | 684 |
| High SAEV scenario | - | - | - | - |
| Vehicle-miles-travelled [km/capita/day] | 11 | 14 | 10 | 35 |
| Consumption with 0% AD savings* [Wh/capita/day] | 112 | 563 | 1566 | 2241 |
| Consumption with 40% AD savings* [Wh/capita/day] | 67 | 337 | 939 | 1345 |
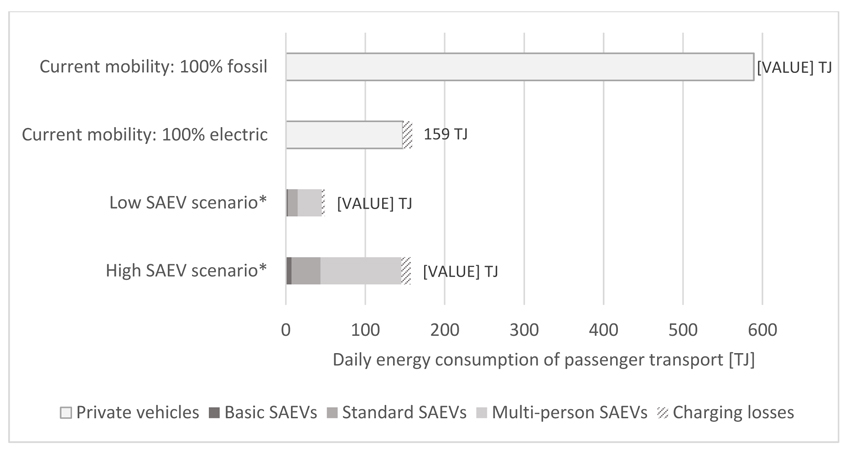
The findings from Table 1 can be used to estimate the energy consumption from passenger vehicles of a society, either tank-to-wheel, or extending the analysis by adding local well-to-tank and Life-Cycle Analysis (LCA) figures. However, they are most accurate for the Netherlands as the mileages are based on Dutch mobility behaviour. The current tank-to-wheel energy consumption of passenger vehicles in the Netherlands is around 589 TJ/day (14.3 vehicle-kilometres-travelled/day/ capita and an assumed average fossil fuel consumption of 7.0 L/100km at 36.8 MJ per liter1. Electrification of private passenger vehicles reduces this by about 75% to 160 TJ/day. When passenger mobility is completely transformed with SAEVs, the mobility demand is significantly higher, however, due to fit-for-purpose and automated driving, the energy consumption of passenger vehicles will be less than with 100% privately owned electric vehicles. (Fig. 5). In the low SAEV scenario, with maximum energy savings from autonomous driving (40%), and in the high SAEV scenario, with minimum energy savings from autonomous driving (0%), the tank-to-wheel energy consumption estimates for passenger transport in the Netherlands range from about 50 TJ/day and 160 TJ/day. These are reductions of 92% to 73% of the current figures.
5. RESULTS
The findings in the previous section indicate the importance of transitioning towards fit-for-purpose shared autonomous electric vehicles with respect to reducing the environmental impact of passenger transport. Even if mobility demand almost triples due to SAEVs, the tank-to-wheel energy consumption with shared autonomous electric vehicles will be similar to that of our current passenger vehicles completely electrified. This indicates the immense inefficiency of our current culture around vehicle ownership where the vast majority of trips are made with relatively large, heavy and inefficient vehicles. It also means that induced demand has the potential to negate the positive effects of energy-efficient fit-for-purpose vehicles, stressing the importance of adequate policy making with regards to mobility behaviour and OEMs (who potentially benefit from continuously increasing the size and weight of vehicles).
With fit-for-purpose SAEVs being a pioneering technology in this research area, the road ahead is still unclear. Future researchers are encouraged to use or enhance the findings, the scenarios and the simulation model of this work. Our methodology allows for easy adjustment of the input parameters, like the energy efficiencies of SAEVs and their vehicle-miles-travelled2, once more data becomes available. The transformed mobility scenario can also be adjusted, for example, to a scenario where one-person vehicles become a small niche solution instead of a widely adopted mode of transport. And because the transformation of the mobility system will be locally shaped by political, technological, economic and cultural environments, different scenarios should be defined for each case study. Our assumptions regarding vehicle choice are based on a simplistic rational-actor model that can be improved by pilots and surveys that determine people’s attitudes towards sharing autonomous driving vehicles with different form factors.
Energy consumption itself is just a proxy for emissions and needs to be implemented in energy and integrated assessment models. The tank-to-wheel estimates of this research can be complemented with well-to-wheel estimates and life-cycle analyses that also include the energetic cost of manufacturing and recycling. Detailed discussions on these topics, especially their (local) figures in future societies, are suggested as further research. Particularly, the life-cycle analyses of the described mobility systems are interesting because of the potentially reduced resource intensity of smaller and lighter vehicles, and because the amount of vehicles required in a shared system is several factors lower than with privately owned vehicles [27].
With mobility converging towards electric, the future integrated energy system, with clean decentralized production and smart charging schemes, will play an important and complex role in the well-to-wheel analysis of such scenarios. Also, as electricity becomes cleaner, the disadvantages of combustion engines will increase but the advantages in terms of emissions of sharing and downsizing will decrease.
Finally, there are other major societal impacts of SAEVs besides the energy consumption. For example, liveability of cities, road safety, access to mobility and production emissions of the transportation sector. SAEVs open doors to cities with cheap, safe, silent, and non-polluting transportation for everybody. The vehicles could use smaller roads and require no visible parking space. Allowing oneself to imagine the potential of fit-for-purpose SAEVs makes clear they can have a transformative effect on our cities. It seems this warrants more research.
CONCLUSION
In this paper, the tank-to-wheel energy consumption of passenger transport at full adoption of fit-for-purpose Shared Autonomous Electric Vehicles (SAEVs) is explored by 1) defining a perspective on a completely transformed mobility system, 2) estimating the energy consumption of several vehicle types in such a system, and 3) estimating the vehicles-miles-travelled per vehicle type. Particularly novel in this research is the analysis of full adoption of fit-for-purpose vehicles, which are energy efficient and, mainly, one-person vehicles, and the implementation of newly induced mobility demand. SAEVs are expected to cause modal shifts from other modalities, more frequent trips, longer distance trips, entry of user groups, and additional reallocation mileages of the vehicle fleet.
A future SAEV fleet will exist of different types of vehicles to fit the demand of different trips. This research defined three types of SAEVs in such a system. Basic podbike-like SAEVs for local short trips with up to 60 km/h and an energy consumption of 1 kWh/100km. Standard one-person SAEVs with an energy consumption of 4 kWh/100km for longer and highways trips. And multi-person or luxury SAEVs with an energy consumption of 16 kWh/100km for all other purposes. The estimations of the vehicle-miles travelled in the transformed mobility system follow from an agent-based mobility model that simulates current mobility behaviour of the Netherlands and SAEV induced demand with fit-for-purpose vehicles.
The results showed that about 75% to 90% reduction in energy use from passenger vehicles can be achieved despite increases in vehicle-miles-travelled of 150% and 30%, respectively. Electrification accounts for about 75% of the reduction in energy consumption and autonomous driving for 0% to 40%. This means that fit-for-purpose vehicles would reduce the energy consumption for an additional 60% reduction in energy consumption.
The adoption of fit-for-purpose SAEVs into passenger mobility is still highly speculative. As such, these results should be seen as the first exploration of full adoption scenarios. Nevertheless, it is promising that the continuous growth of passenger transport does not necessarily mean an increase in tank-to-wheel energy consumption. Shared autonomous electric fit-for-purpose vehicles might actually be the way to sustainable passenger transport while, at the same time, making our cities more liveable and improving safety, accessibility and utility of mobility.
NOTES
1 At a fuel mix of 60% diesel and 40% petrol [33].
2 The simulation model that determined the vehicle miles traveled in this research [ 27 ] is open source and can be found online at the Anylogic cloud at: https://cloud.anylogic.com/model/1866aef3-50ce-435d-beb0-84348df5e700?mode=SETTINGS
CONSENT FOR PUBLICATION
Not applicable.
AVAILABILITY OF DATA AND MATERIALS
Not applicable.
FUNDING
This research is supported by the Dutch Technology Foundation STW, which is part of the Netherlands Organization for Scientific Research (NWO), and which is partly funded by the Ministry of Economic affairs. The research is also funded by the Horizon 2020 project ‘Electric Mobility Without Frontiers’ under grant agreement No 811171.
CONFLICT OF INTEREST
The authors declare no conflict of interest, financial or otherwise.
ACKNOWLEDGEMENTS
Declared none.

