All published articles of this journal are available on ScienceDirect.

Pedestrian Compliance at Signalized Intersections along Major Arterials
Abstract
Background:
Pedestrian non-compliance at signalized crossings is unsafe and considered one of the causes of pedestrian crashes. The speed limit on most major urban roads is 60 km/hr or less. However, the speed on some urban roads is higher in some countries. In this case, the situation is more unsafe and increases the possibility of fatal injuries or fatalities in the case of a crash. Therefore, it is expected that the pedestrians will be more cautious on these roads.
Aim:
This study aims to explore pedestrian compliance at signalized intersections on major arterials with 80 km/hr speeds in Qatar.
Methods:
Video data were collected for pedestrian movements at multiple intersections.
Results:
The study reported a 68.1 percent compliance rate at the study locations. The results also revealed that 14.6 percent of the pedestrians crossed during the Flashing Don’t Walk interval and 17.3 percent crossed during the Steady Don’t Walk interval. These rates are considered high compared to other countries. Several variables that may influence pedestrians’ behavior were investigated. Binary and ordinal logistic regression models were developed to describe the pedestrian crossing behavior as a function of these variables.
Conclusion:
Male and middle-age pedestrians were more likely to cross during these two intervals. The analysis showed that female pedestrians, elder pedestrians, pedestrians crossing in groups, pedestrians waiting before crossing, and pedestrians crossing against a flow of other pedestrians are more likely to comply and cross during the Walk interval compared to other groups. Several solutions were proposed in the study to increase compliance rates.
1. INTRODUCTION
A high percentage of pedestrian crashes occur at signalized intersections [1, 2]. Many of these crashes are caused by pedestrian violations [3, 4]. Adding crosswalks at signalized intersections provides designated crossing locations for pedestrians and separates them from traffic. Previous research indicated that the presence of crosswalks increase pedestrian safety as well as crossing compliance when properly used as they reduce potentials for pedestrian crash occurrences [5, 6]. However, many pedestrians crossing at signalized intersections tend not to comply with pedestrian signals, especially at times when low vehicular traffic flows are observed.
Several studies investigated the influences of personal features on street-crossing behavior. Pedestrian characteristics such as gender and age have been shown to be important contributing factors to pedestrian violations. Many studies have reported that male pedestrians violate traffic rules more frequently than females and are more likely to cross in riskier situations [7-11]. One study showed opposing findings with male pedestrians observed to be more likely to comply with traffic rules on signalized crosswalks [12]. When it comes to age, previous studies showed that older pedestrians wait for a longer time than younger ones at crossing signals [7] and they also appear to be more inclined to comply with traffic laws [12-14]. In some cases, age failed to yield significant differences in offending crossing behaviors [9].
Compliance rates reported in the literature imply that pedestrian compliance varied from location to location, city to city, and neighborhood to neighborhood. Pedestrian character- istics, user preferences, and habits are expected to affect compliance rates. Therefore, the comparison of crossing compliance rates from one place to another may not be meaningful without knowing the local pedestrian character- istics. Limited studies investigated pedestrians’ compliance behavior in Qatar and the surrounding region. This region includes Qatar, Oman, Bahrain, United Arab Emirates, Saudi Arabia, and Kuwait. This study aims to identify the compliance rate along major arterials in Qatar. The current study presents an extension of our previous work on pedestrian crossing speeds in Qatar [15].
2. METHODS
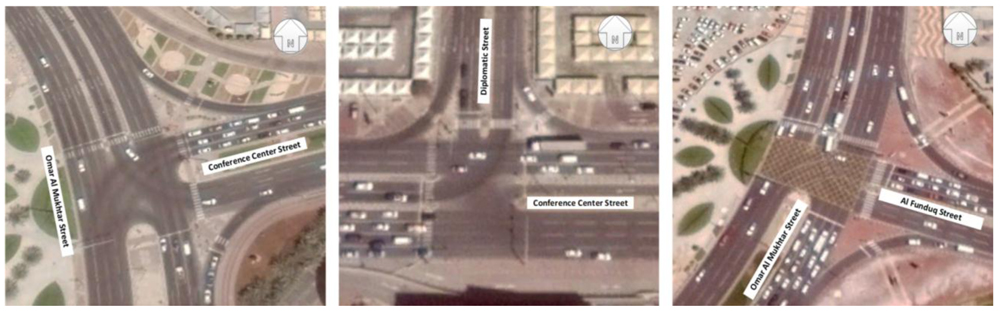
The common speed limit on major urban roads is 60 km/hr or less [16]. However, the speed on most major urban roads in Qatar is 80 km/hr. In this case, the situation is more unsafe and increases the possibility of fatal injuries or fatalities in the case of a crash. Three similar intersections along major arterials in the city of Doha were chosen for this study. The selected intersections were typical in size, as illustrated in Fig. (1). All intersections were also located in the same area. When possible, various crossing options should be evaluated in the same environment. This approach is preferred for more meaningful comparisons since the effects of pedestrian characteristics can be isolated from the crosswalk and geometric features of pedestrian paths and roadways. Previous research pointed out the impact of the environment on pedestrian behavior [17-20]. For example, the layout of the crosswalk including type, length, and width can affect pedestrian compliance [17, 18]. Therefore, by selecting almost identical sites, the analysis is focused mainly on human factors. The video data were collected for a total of 24 hours at each location.
The extracted data included 1,423 pedestrians. Our previous work showed that the observed 15th percentile speed in this region (1.03 m/s) [15] was marginally lower than the speed recommended in the Manual on Uniform Traffic Control Devices (MUTCD) (1.07 m/s) [21] and the National Cooperative Highway Research Program (NCHRP) Report 562 (1.13 m/s) [22]. Different characteristics were obtained from the data, such as gender, age group, type of clothing, carrying bags, using a mobile phone, and waiting time. The age group of the pedestrians was simplified to three types: children, middle-age, and elders to reduce the possibility of error [23, 24]. The type of clothing was used to identify the residents that wear a traditional type of cloth called “thoub” for male and “abbayah” female. The presence of other pedestrians on the road while crossing was included in the analysis in the form of two variables. The first variable, flow with, indicates that other pedestrians are crossing in the same direction at the same time. The second variable, flow against, indicates that other pedestrians are crossing from the opposite direction of the selected pedestrian at the same time of crossing.
3. RESULTS
3.1. Pedestrian Behavior
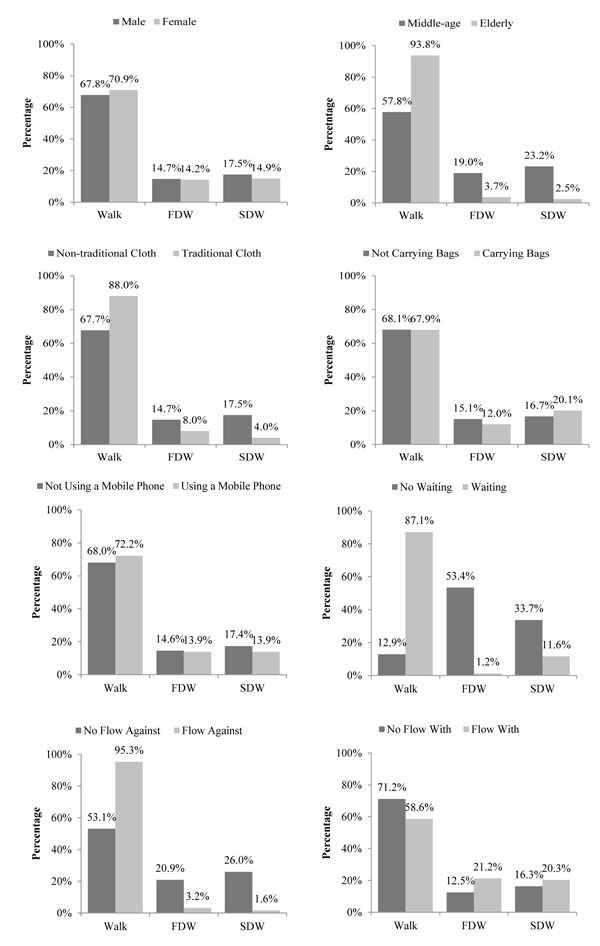
The pedestrian crossing behavior was classified into three cases; began crossing during the “Walk” time, crossing during “Flashing Don’t Walk” (FDW), and crossing during the “Steady Don’t Walk” (SDW) time. Most of the pedestrians (68.1%) were observed crossing during the Walk interval. A low percentage (14.6%) were observed crossing during the FDW interval, and during the SDW interval (17.3%). The majority of all pedestrians (89.0%) crossed when no vehicles were present. The data showed a low number of female pedestrians (9.4%), children (0.2%), pedestrians with traditional clothes (1.8%), and pedestrians using their phones while crossing (2.5%). These percentages are typical for the city of Doha [25, 26]. Furthermore, 25.7% of all pedestrians did not wait before crossing. A reasonable percentage of pedestrians were observed crossing with a flow against (35.6%), crossing with a flow in the same direction (24.2%), and carrying bags (16.4%). Fig. (2) shows the pedestrian characteristics for the Walk, FDW, and SDW cases for the different variables. Due to the limited number of children observed (three pedestrians), this data is not included in the age chart.
3.2. Logistic Regression
In this study, logistic regression models were used to explain the crossing behavior of pedestrians. The first binary model was used to differentiate pedestrians’ behavior during the Walk interval from other behaviors (either FDW or SDW intervals). The ordinal model was used to differentiate between Walk, FDW, and SDW. Due to the limited observations of children, this data was excluded from the logistic regression analysis resulting in 1,420 pedestrians.
3.3. Binary Logistic Describing Walk vs FDW/SDW
Binary logistic regression is an appropriate statistical technique when the independent variable is binary. It represents two groups of interest, with values of 0 and 1. The procedure for estimating the coefficients is a maximum likelihood, and the goal is to find the best linear combination of independent variables to maximize the likelihood of obtaining the observed outcome frequencies [27, 28]. Binary logistic regression takes the following form (Eq. 1):
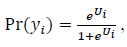
where Pr (yi) is the probability of observation i being a success. The term Ui is a utility function that is related to the independent (explanatory) variables in the following linear form (Eq. 2):
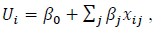
where βj are coefficients to be estimated and xij are observed explanatory variables associated with observation i.
The first model considered two outcomes: a pedestrian crossing during the Walk interval (success) or any other behavior (failure). The other outcomes included both FDW or SDW intervals. The final model presented in Table 1 lists the model estimation and the odds ratio for the independent variables. In this model, the following baseline conditions are assumed for the independent variables: male, middle-age, traditional clothing, not carrying bags, not using a phone, not crossing in a group, did not wait before crossing, no flow against, and no flow with. The model showed that the odds of female pedestrians crossing the road during the Walk interval is 1.8 times higher than the odds of male pedestrians. The model also indicated that the odds that an elder pedestrian crossing the road during the Walk interval is 3.8 times higher than the odds of the middle-age pedestrians. The odds of pedestrians crossing in groups during the Walk interval is 2.8 times the odds of a pedestrian crossing alone. Compared to pedestrians not waiting, pedestrians waiting before crossing are 32 times more likely to cross during the Walk interval. Pedestrians crossing against flow are 11.1 times more likely to cross during the Walk interval. Finally, pedestrians crossing with flow are 2.1 times less likely to cross during the Walk interval.
Ordinal Logistic Model Describing Walk vs. FDW vs. SDW
The second model considered all potential stopping outcomes: Walk, FDW, or SDW. Failure to consider the differences could lead to an inaccurate understanding of the impacts of explanatory variables on the pedestrian’s behavior. To fully capture these effects, ordinal logistic regression was estimated and compared to the binary logistic regression model previously described. Ordinal logistic regression is applied to categorical responses with an ordered structure; e.g., not successful, somewhat successful, and successful. In general, the ordinal logistic regression model takes the following form (Eq. 3):
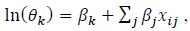
where θk represents the proportional odds of an equal or smaller response occurring (Pr(yi ≤ k) compared to a larger response occurring (Pr(yi > k) defined as follows (Eq. 4):
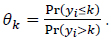
For a categorical response variable with K outcomes, K - 1 proportional odds ratios (i.e., intercepts/constants) are needed to define the model since Pr(yi > K) = 0.
| Estimate | Standard Error | Wald | df | p-value | Odds Ratio Exp(B) | 95% Confidence Interval | |||||
|---|---|---|---|---|---|---|---|---|---|---|---|
| Lower | Upper | ||||||||||
| Constant | -5.399 | 0.758 | 50.790 | 1 | <0.001 | 0.005 | - | ||||
| Group [Yes] vs [No]* | 1.056 | 0.288 | 13.445 | 1 | <0.001 | 2.876 | 1.635 | 5.058 | |||
| Waiting [Yes] vs [No]* | 3.492 | 0.202 | 299.145 | 1 | <0.001 | 32.841 | 22.109 | 48.781 | |||
| Flow Against [Yes] vs [No]* | 2.411 | 0.347 | 48.398 | 1 | <0.001 | 11.141 | 5.649 | 21.973 | |||
| Age [Elder] vs [Middle-age]* | 1.344 | 0.387 | 12.095 | 1 | 0.001 | 3.835 | 1.798 | 8.182 | |||
| Flow With [Yes] vs [No]* | -0.765 | 0.287 | 7.110 | 1 | 0.008 | 0.466 | 0.265 | 0.817 | |||
| Gender [Female] vs [Male]* | 0.578 | 0.287 | 4.057 | 1 | 0.044 | 1.782 | 1.016 | 3.128 | |||
| Phone Use [Yes] vs [No] | 0.935 | 0.531 | 3.106 | 1 | 0.078 | 2.548 | 0.900 | 7.210 | |||
| Clothing [Non-traditional] vs [Traditional] | 0.138 | 0.927 | 0.022 | 1 | 0.881 | 1.149 | 0.187 | 7.060 | |||
| Carrying Bags [Yes] vs [No] | -0.022 | 0.217 | 0.010 | 1 | 0.919 | 0.978 | 0.640 | 1.496 | |||
| - | - | Estimate | Standard Error | Wald | df | p-value | 95% Confidence Interval | |
|---|---|---|---|---|---|---|---|---|
| - | - | - | - | - | - | - | Lower | Upper |
| Threshold | Compliance=Walk | 4.028 | 0.972 | 17.162 | 1 | <0.001 | 2.122 | 5.933 |
| Compliance=FDW | 5.237 | 0.977 | 28.724 | 1 | <0.001 | 3.322 | 7.152 | |
| Location | [Group=No]* | 0.853 | 0.237 | 12.953 | 1 | <0.001 | 0.388 | 1.317 |
| [Group=Yes] | 0a | - | - | 0 | - | - | - | |
| [Ped Waiting=No]* | 2.225 | 0.149 | 224.235 | 1 | <0.001 | 1.934 | 2.517 | |
| [Ped Waiting=Yes] | 0a | - | - | 0 | - | - | - | |
| [Flow Against=No]* | 2.093 | 0.328 | 40.684 | 1 | <0.001 | 1.450 | 2.736 | |
| [Flow Against=Yes] | 0a | - | - | 0 | - | - | - | |
| [Age=Middle-age]* | -0.716 | 0.354 | 4.101 | 1 | 0.043 | -1.410 | -0.023 | |
| [Age=Elder] | 0a | - | - | 0 | - | - | - | |
| [Flow With=No]* | -0.452 | 0.231 | 3.804 | 1 | 0.051 | -0.905 | 0.002 | |
| [Flow With=Yes] | 0a | - | - | 0 | - | - | - | |
| [Gender=Male]* | 0.400 | 0.233 | 2.966 | 1 | 0.085 | -0.055 | 0.856 | |
| [Gender=Female] | 0a | - | - | 0 | - | - | - | |
| [Ped Phone Use=No] | 0.718 | 0.432 | 2.760 | 1 | 0.097 | -0.129 | 1.565 | |
| [Ped Phone Use=Yes] | 0a | - | - | 0 | - | - | - | |
| [Clothing=Non-traditional] | 0.122 | 0.844 | 0.021 | 1 | 0.885 | -1.531 | 1.776 | |
| [Clothing=Traditional] | 0a | - | - | 0 | - | - | - | |
| [Carrying Bags=No] | 0.029 | 0.180 | 0.026 | 1 | 0.873 | -0.323 | 0.381 | |
| [Carrying Bags=Yes] | 0a | - | - | 0 | - | - | - | |
The ordinal model covered all possible outcomes: Walk, FDW, or SDW, as shown in Table 2. The following baseline conditions are assumed: female, elder, traditional clothing, carrying bags while crossing, using phone while crossing, crossing in a group, waiting before crossing, walking with flow, and walking against flow. Interestingly, the trends revealed by the ordinal logistic regression model were similar to those provided by the simpler binary logistic regression. Males were found to be more likely to cross during the FDW and SDW intervals compared to females. Similarly, pedestrians with non-traditional clothing were found to be more likely to cross during the FDW and SDW intervals compared to pedestrians with traditional clothing. Pedestrians waiting before crossing were more likely to cross during the Walk interval. The ordinal logistic regression model also revealed that pedestrians crossing with the flow were more likely to cross during the FDW and SDW intervals, on the contrary of the pedestrians crossing against the flow. The clothing type, carrying bags, and using a phone while crossing variables were not found to influence crossing behavior in a statistically significant way.
CONCLUSION
The purpose of this study was to investigate pedestrians’ compliance at signalized intersections along major arterials in Qatar. This study is one of the first efforts to study pedestrians’ compliance in this region and provides insight into the factors related to crossing behavior. All main roads at the studied intersections had a speed of 80 km/hr. A 68.1 percent compliance rate was observed at the different locations. This percentage is considered less than the compliance rate in several countries in other regions. For example, a study at multiple intersections in New York found that the lowest compliance was 79.7 percent [29]. Another study in Ohio reported that the pedestrian crossing compliance rate was 85.4 percent [30]. A study in Beijing reported 70 percent and 57 percent compliance rates at two locations [31].
The study also revealed that pedestrians who crossed during the FDW and SDW intervals were 14.6 percent and 17.3 percent out of the total sample. It should be noted that the possibility of a pedestrian crash is much higher while crossing during the SDW interval [3]. Males and pedestrians with non-traditional clothing were found to be more likely to cross during the FDW and SDW intervals compared to females and pedestrians with traditional clothing. Moreover, pedestrians waiting before crossing were more likely to cross during the Walk interval and pedestrians crossing with other pedestrians crossing in the same direction were more likely to cross during the FDW and SDW intervals. A reason can be that pedestrians feel safer taking the risk of crossing as a group during the FDW and SDW intervals.
The current study makes a significant contribution in pedestrians’ behavior literature, as it sheds light on pedestrians’ compliance levels in Qatar, a country in the Arabian Gulf region. The low compliance identified in the study can be alarming for Qatar and different countries with similar characteristics in the Arabian Gulf region, including Oman, Bahrain, United Arab Emirates, Saudi Arabia, and Kuwait. Public agencies and transportation authorities in Qatar and other countries in the region should develop different strategies to achieve higher compliance.
One solution that is not currently implemented in Qatar is the use of pedestrian countdown timers (PCT). PCT provides additional information to the pedestrians by providing information regarding the amount of remaining time to complete the crossing movement, which improves their comprehension of the FDW signal. Previous research found that the PCT is easier to understand as compared to the conventional FDW signal [32]. This resulted in pedestrians taking more informed decisions regarding their crossing- either to start or stop and wait until the pedestrian Walk interval. Once implemented, their effectiveness should be investigated in the future.
Also, lower-speed roads are directly related to a lower risk of pedestrian-vehicle collision and injuries [33]. Therefore, consideration should be given to reducing speed limits to 60 km/hr or less in urban areas. Moreover, some studies found that a high percentage of pedestrians do not understand the FDW indication [34, 35]. Testing the knowledge of the pedestrians and identifying proper countermeasures to increase the knowledge and educate pedestrians should be investigated in the future. Finally, low levels of enforcement for pedestrian violations exist in this region [36]. Therefore, more strict enforcement should be implemented at signalized intersections.
A number of limitations with the current study should be noted. The study focused on one type of crosswalk to focus on pedestrian characteristics and eliminate any other factors. Some studies pointed to the effect of the environment on pedestrian behavior and injuries [20, 37]. Thus, it is important to study different types of crosswalks and different environmental settings to identify the types of facilities pedestrians favor and the attitudes of pedestrians towards such facilities. In addition, studying additional intersections to cover a larger sample of females and children can provide more information regarding these two groups. However, the low number of female and children pedestrians is common in Qatar, as indicated by previous studies [38-40]. Furthermore, several outstanding questions remain regarding the reasons for different pedestrians’ behaviors at signalized intersections. Therefore, future research should examine if pedestrians are more likely to make deliberate violations versus errors at crossings, confirm whether violations are consistent across different groups, and identify factors to increase the likelihood of compliance. These goals can be achieved by conducting a questionnaire survey with a reprehensive sample of the population.
CONSENT FOR PUBLICATION
Not applicable.
AVAILABILITY OF DATA AND MATERIALS
Not applicable.
FUNDING
None.
CONFLICT OF INTEREST
The author declares no conflict of interest, financial or otherwise.
ACKNOWLEDGEMENTS
Declared none.

