All published articles of this journal are available on ScienceDirect.

The Need of E-ticket to Support the Public Bus Service Improvement Policy in a Developing Country
Abstract
Background:
Public buses are a major transportation mode in large cities in the developing country Indonesia. Nevertheless, most societies still use passenger cars. Therefore, the road authority has developed an important policy to improve public bus services soon. One of the public bus services is to change the bus operational system, including the manual ticketing system to an electronic ticket (e-ticket) system. In order to make the policy succeed, the road authority should ask for passengers’ opinions.
Objective:
The purposes of this study are to ensure that the bus e-ticket is needed to support the policy and then to determine important priority factors of bus e-ticket implementation.
Methods:
The data were collected using a direct survey with a questionnaire in large cities, Surabaya and Denpasar in Indonesia. A total of 565 bus passengers participated in this survey. An analysis was conducted through cross tabulation between the respondents’ demographic data and their perceived level of need and priority of implementation with regard to various factors of the e-ticket system. The Simple Additive Weighting method was used to determine the important priority factors.
Results:
Results indicated that a bus e-ticket needed for the cross tabulation average value is more than 3.60 out of 5.00 for all factors. Furthermore, the three highest values of factors based on the Simple Additive Weighting method are ease of access, availability of the bus routes information, and affordability of the e-ticket price.
Conclusion:
Since respondents indicate that the e-ticket is needed and is a priority, then the policy is beneficial not only to improve bus services in Indonesia but also in other developing countries with similar traffic and geometric conditions.
1. INTRODUCTION
In addition to paratransit, trains, and ships, public buses are a major transportation mode in large cities in Indonesia. Unfortunately, most societies prefer to use passenger cars rather than the public bus. Therefore, road authorities will implement an important policy to improve the public bus services not only from the infrastructure side that is costly and time consuming, but also from the system side, including an electronic ticketing (e-ticket) system [1-9].
Up until now, there are only a few public buses that have implemented e-ticketing systems. Among all bus route operations in all large cities in Indonesia, only a few routes implement bus e-ticket. The rest are still using manual ticketing systems that consume a lot of time to queue and stay. Therefore, a study related to the need and the priority level of e-ticket implementation is crucial [1, 2, 6, 10-12] and can serve as a policy to improve bus services to the society [3-5, 7, 9, 13-18], especially in developing countries [1, 8, 19-26].
The purposes of this study are to ensure that the bus e-ticket is needed to support the public bus service improvement policy and then to determine important priority factors of bus e-ticket implementation that are required to improve public bus services in a developing country, based on level of need and level of priority of bus passengers’ opinion. Case studies are carried out in Surabaya and Denpasar, two large cities of the developing country of Indonesia.
Using a large field of data obtained from a validated and reliable questionnaire, a cross-tabulation analysis comparing the factors needed and prioritized by respondents and respondents’ demographics produce detailed results that are very beneficial for city bus authority to improve public bus services practically. Furthermore, the results will be used as the basis for the bus authorities to implement the public bus policy soon. In addition, the policy can be implemented in other large cities in Indonesia and other developing countries with similar traffic and geometric conditions.
2. MATERIALS AND METHODS
2.1. Literature Review
2.1.1. Bus Public Transport in Indonesia
Public transport buses in Indonesia are organized by the government. They have to obey certain regulations governing public bus transportation in Indonesia, i.e., regulation no. 22, 2009 about traffic and road transport, and regulation no. 74, 2014 about road transport. The bus operation has to fulfill the minimum service standards (safety, security, convenience, comfortability, affordability, equality, and regulation), the supporting physical facilities (bus terminals, bus shelters, and bus stops), and the bus service criteria (a fixed route, time table, information system) including ticketing system [27, 28].
In fact, there are only a few public buses in large cities in Indonesia that have implemented an e-ticketing system. Whereas, implementation of the bus e-ticket system can encourage society to use public transportation rather than use the passenger car that can lead to traffic congestion. In order to ensure that society uses public transportation, including buses, an important policy to improve bus services by implementing an e-ticketing system will soon be made by the road authority. Moreover, the bus public transport services have to be maintained consistently and continuously.
2.1.2. E-ticket Services of the Bus Public Transport
E-ticketing system is a ticket entry to many transportation modes, including airline, railways, and public bus with paperless, easy and fast processes. This service system satisfies customers. Many studies regarding bus operations that implement e-ticketing systems indicate an increase in the number of passengers, passengers’ satisfaction and also increase in public bus services [1, 2, 19, 21, 22, 25, 26, 29-34].
Although there are previous studies regarding e-ticket system, these studies only have a small number of respondents, a small area of case studies location, without a preliminary survey, and a valid and reliable questionnaire to determine the factors of bus services; and without further analysis, the method to determine important priority factors cannot be implemented. Moreover, results of these studies cannot be implemented practically in large cities in Indonesia that have specific characteristics, for example, low road density ratio between road area and city area, various substandard lane width, and low adherence to the traffic regulations. Therefore, this study could overcome many research gaps with a large data set and then the results of the study could be implemented practically in many large cities in Indonesia immediately.
A number of previous studies show that factors of bus services regarding implementing a bus e-ticket system are accessible buses [15, 17, 19, 21, 26, 29], better ticketing [2-5, 8, 21, 29], passenger information [9, 29], bus fare [1-4, 6, 10, 15, 16, 19, 25, 29], proper schedule [1, 29], rational routing [17, 22, 23, 29], and quality of services [1, 5, 13-16, 18, 20-22, 25, 26, 29].
In addition, other related previous studies said that factors that are particularly relevant to improve the services of bus operation are safety [13, 21, 25], transit route [9, 30], schedule [1, 9, 17, 30], delay [17, 30], comfort [19, 21, 25, 26], convenience [4, 6], information technology [2, 3, 9, 30], travel time [13, 15, 19, 22], stopping schedule [13, 22, 30], waiting time [4, 6, 30], waste time [19, 30], time of operation [16, 21, 30], ticketing system [2-6, 8, 30], and passengers’ behaviour [7, 9, 24, 26].
Nevertheless, all these previous studies did not provide information about the number of respondents, a preliminary survey, and a validity and reliability questionnaire to determine the factors.
In more detail, some more previous studies are as follows: a study regarding an impact of e-ticketing policy on customer satisfaction in Jordan found that customer satisfaction in 12 months implementation of e-ticket services was influenced by all variables, including technical and customer support, user-friendliness, data security, and e-ticketing services, have an important impact on customer satisfaction [31]. Another study about the impact of the e-ticket implementation policy on one bus transportation in Bandung, Indonesia indicated that there is a positive impact on the application of an e-ticket system in using public transport in their daily activities and reducing traffic congestion because of comfort and convenience in ticket services [32].
Furthermore, a study of a new way of buying e-ticket in Malaysia found that young, higher income, and educated passengers who have been using e-ticketing for two years, experience increasing convenience and ease in purchasing tickets [33]. A study regarding service quality satisfaction rate of public bus in Pulau Pinang, Malaysia has the results that seat and air conditioner in the bus, disable access, bus fare, bus ticket access, and adherence of traffic regulation by bus driver are the main factors that influence society to use public bus [22], and a study about bus services in Universiti Utara Malaysia showed that satisfaction factors that influence the students as respondents are bus driver’s attitude, availability of the bus, and bus facility [26].
In addition, the results of a study about policy in developing an online transportation service reservation system of bus tickets in Nigeria indicated that e-ticketing system is efficient and reduces time to buy and queue [34].
Furthermore, a study in Ho Chi Minh City, Vietnam showed that factors that influence passenger car users to use bus public transport are time, fare, comfort, occupation, distance between home and workplace, motorcycle ownership, and age [19]; and an urban transport ticketing system in Lithuania was scrutinized in 2010 and results of the study showed that e-ticket equipment and e-ticket functional areas are two effective solutions in e-ticket implementation [2].
Moreover, an evaluation of e-ticketing study in Tehran Bus Network provided that data about better services in bus stations regarding passengers and scheduling, support the authority to implement e–ticket system with 13 percent reduction of fare evasion [1]. An evaluation of public bus transport in Colombo City found out that factors that encourage people to use public transport are easy access, bus comfort, bus service, security, and safety [21], and an evaluation study in Cape Coast University in Ghana found that factors that influence students to use public transport are ticket fare, safety, and comfort [25].
Again, all of these previous studies presented only the general factors, without presenting information about the minimum number of respondents as required in the study, a preliminary survey to determine the factors, a valid and reliable questionnaire to determine the factors, and case studies only in small locations, for example in a specific campus. Then, there was no further cross tabulation analysis to ensure that the e-ticket is needed to support the road authority policy and no further analysis method to determine important priority factors to be implemented practically by the road authority. In this study, all research gaps in previous studies would be overcome, so that the road authority policy could be implemented soon in the large cities.
2.1.3. Pearson Moment, Alpha Cronbach, and Simple Additive Weighting Statistical Methods
Statistical methods are used to ensure that each question/ factor in the questionnaire, as a research measurement tool, fulfils the validity and reliability requirements. The Pearson Moment method as presented in Equation (1) is used to make a valid questionnaire, and furthermore, the Alpha Cronbach method as presented in Equation (3) is used to make a reliable questionnaire [35, 36].
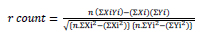 |
(1) |
where rcount is a Pearson Moment correlation coefficient to measure correlation value between each question/ factor and total score of the questions/ factors, while ΣXi is the number of question score, ΣYi is the total number of question score, and n is the number of respondents. Then, t-test is counted using Equation (2). A research measurement tool is valid if the value of tcount is larger than the value of ttable with α =5%. This means that the perception of each respondent to each question in the questionnaire is the same. Otherwise, if the value of tcount is smaller than the value of ttable with α =5%, it means that the perception of each respondent to each question in the questionnaire is not the same, and research has to be repeated.
 |
(2) |
 |
(3) |
where α is an Alpha Cronbach coefficient to measure reliability of each question/ factor in the questionnaire, while r is a correlation coefficient among each question/ factor, and k is the number of questions in scale. A research measurement tool is reliable if the coefficient of Alpha Cronbach α is larger than 0.70 (high reliability). This means that the respondent’s understanding of each question in the questionnaire is consistent.
After the questionnaire as a research measurement tool is valid and reliable, then a cross tabulation analysis method is used to produce properties and characteristics of the large field detail data. The properties and characteristics of the data are beneficial as a basis for decision making. Moreover, Simple Additive Weighting statistical method as presented in Equation (4), is used to determine the value of capability preference from the highest to the lowest. The values can ease the decision maker to determine alternatives with the highest priority to be implemented [37-39].
 |
(4) |
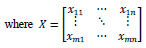
where Vi is a preference value, wj is a weigh factor, and rij is a normalized appraisal of respondent’s demographic Ai for a factor Cj. A is a number of respondent’s demographic, wherein A = {Ai | i = 1,2,..., n} and C is the factors of each respondent’s demographic, wherein C = {Cj | i = 1,2,..., n}. In addition, rij is presented in Equation (5).
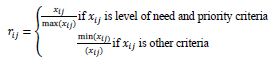 |
(5) |
 |
(6) |
and xij is a performance appraisal of respondent’s demographic i with factor j.
2.2. Research Methodology
The steps of research methodology regarding the need for e-ticket to improve public bus services in a developing country are presented in Fig. (1).
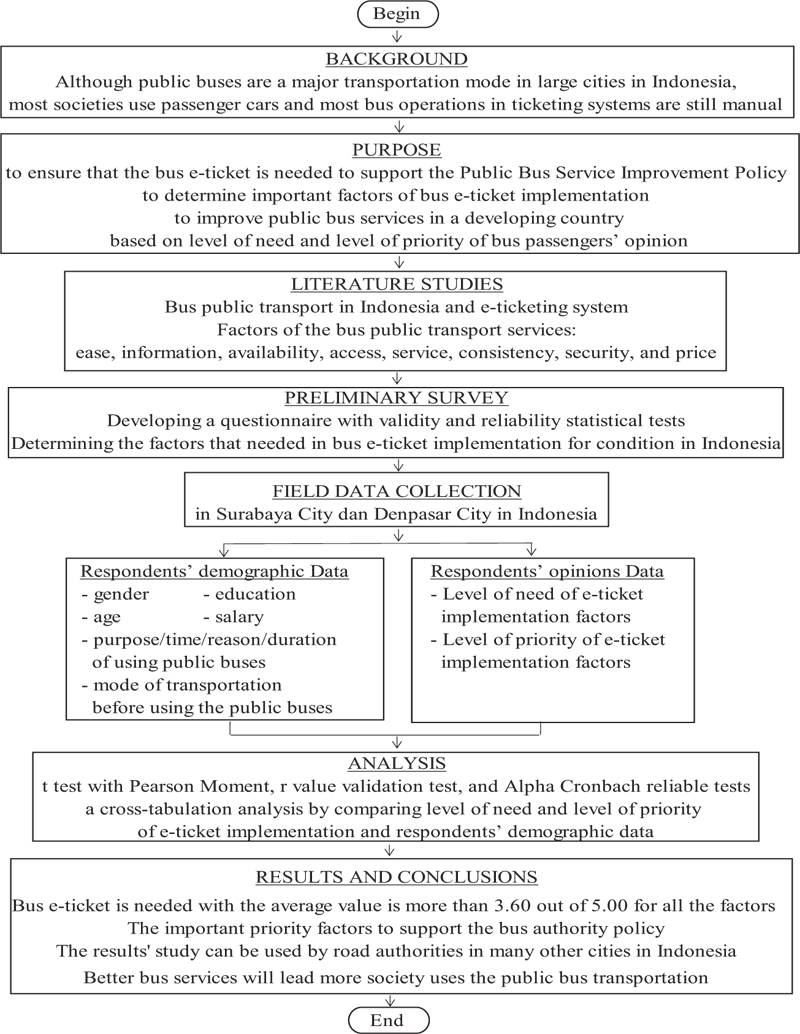
Since there are a number of factors of bus services, therefore, in developing a questionnaire, a preliminary survey is needed to determine the factors that influence the bus e-ticket implementation according to the condition in Indonesia. Alpha Cronbach method and Pearson Moment method are used to determine the factors. Sixty bus passengers as respondents are involved in this preliminary survey. Thirty respondents are from Surabaya City and thirty respondents are from Denpasar City.
All factors fulfil a validity statistical test and a reliability statistical test as presented in Appendix A. The values of Alpha Cronbach of preliminary surveys in both cities are higher than 0.70 for reliability tests. Furthermore, the values of rcount (Pearson Moment r value) are higher than rtable α =5% for validity test and the values of tcount are also higher than the values of ttable α =5% [35, 36]. The factors are then used in the questionnaire to collect the research data.
Data regarding the services of bus e-ticket implementation and respondents’ demographic data were collected through a direct survey with a valid and reliable questionnaire as a tool in bus stations in Surabaya and Denpasar as large cities in Indonesia. In both cities, a bus e-ticket system has been implemented for a few bus routes. Based on the preliminary survey, respondents’ opinions on the need and the priority for e-ticket implementation are ease, information, availability, access, service, consistency, security, and price. Respondents’ demographic data are gender, age, education, salary, purpose/time/reason/duration of using public buses, and mode of transportation before using the public buses.
Furthermore, a cross-tabulation analysis by comparing the level of need and level of priority of e-ticket implementation and respondents’ demographic data will produce detailed important factors that have to be taken into account by bus authority to improve bus services practically. Moreover, Simple Additive Weighting method is used to determine the highest priority factors to be implemented by the public bus authority. These factors support the success of the public bus authority policy. In addition, a hard, consistent, and continuous effort has to be implemented by the authority to enhance the bus services policy to societies.

2.3. Research Data
In this study, a comprehensive dataset related to the public bus transportation e-ticket system was developed using data collected in 2018 in two large cities of Indonesia, namely Surabaya and Denpasar [40, 41]. The locations of the bus stations in Surabaya and Denpasar are shown in Fig. (2) [42]. A questionnaire about the respondents’ demography and another questionnaire about their perceived level of need and level of priority regarding the e-ticket implementation aspects were used as tools to collect data in this direct survey.
Appendix B presents the number of passengers using the bus transport per day (N), the required sample size (n) with a standard error e of 10%, the number of respondents to the survey in Surabaya and Denpasar, and the total number of respondents to the survey. The data in Appendix B indicate that the sample size used in the survey, i.e., 565 bus passengers as respondents, is significantly valid because this number is much larger than the minimum sample size of 196 persons required [35].
Appendix C presents the demographic data of the bus passenger respondents in Surabaya and Denpasar. The respondents’ demographic data in Appendix C is gender, age, education, salary, the purpose of using the public buses, weekly frequency of using the public buses, reasons for using the public buses, how long have they been using the public buses, and their mode of transportation before using the public buses. Appendix D presents detailed data on the level of need and level of priority with respect to specific factors of e-ticket implementation. Appendix E presents a summary and average data values of all the passengers’ opinions/answers regarding the level of need and level of priority of the e-ticket implementation factors.
3. RESULTS AND DISCUSSIONS
The data in Appendix B related to the number of minimum respondents for the sample size required proves that the dataset collected in the survey is valid and can be analyzed. Moreover, a cross tabulation between the passenger’s opinion regarding the level of need and level of priority of the e-ticket implementation and the passengers’ demographic data from Surabaya and Denpasar is presented in Tables 1 and 2. The cross-tabulation data in Tables 1 and 2 are used for a more detailed analysis.
Furthermore, in the Likert scale used in Appendix D, a value of “1” means least needed; and a value of “5” means most needed. Similarly, a value of “a” means the aspect has the least priority, and a value of “e” means the aspect has the most priority. Based on Appendix D, data on the level of need and level of priority of the e-ticket implementation aspects in Surabaya and Denpasar are summarized in Appendix E [35, 43]. This appendix not only presents the need and the priority of bus e-ticket implementation in general, but also indicates the performance of e-ticket implementation in Surabaya and Denpasar, in particular. Thus, the data in Appendix C related to the demographics of the bus passengers as respondents in Surabaya and Denpasar in Indonesia, respectively, were compared to the data in Appendix E to provide a cross tabulated data, as presented in Tables 1 and Table 2. The large dataset in Tables 1 and 2 are very beneficial in analyzing, by the comparison method, to unearth more details about what factors are needed and their priorities based on the respondents’ demographics. Then, from the cross-tabulation data, the preference value of priority factors of bus e-ticket to be implemented based on the Simple Additive Weighting method are presented in Table 3.
Based on data and analysis presented in Appendix E and Tables 1-3, important findings and recommendations to be implemented in the bus e-ticket system policy, soon and practically, by public bus authority are:
(1) Since the average value of the level of need and the level of priority in Appendix E is more than 3.60 out of 5.00 for all the factors, it proves that the bus e-ticket implementation is really needed. Furthermore, it can be used by bus authorities to establish a transport policy regarding bus e-ticket implementation.
(2) Moreover, it can be seen in Appendix E that the three factors with the highest values of level of need and level of priority, based on the respondents’ opinions, are ease of access to information about the e- ticket system (F1), availability of information about the bus routes when purchasing an e-ticket (F3), and affordability of the e-ticket price (F10). These factors have to be taken into account while implementing the system.
(3) Using the cross-tabulation values in Tables 1 and 2, the bus authority can develop detailed transport policies to improve the public bus service. The detailed transport policies are as follow: based on the gender, the purpose of using the bus, and transportation mode used before using the public bus, level of need and level of priority appear to be similar; likewise, it appears that the higher the age, education level, salary, and frequency, the higher the levels of need and levels of priority for those respondents; based on the reason for choosing the bus, the highest level of need and level of priority, is security. It means that the public bus authority has to improve the bus security; according to how long the respondents have been using the bus, it may be noticed that the longer the respondents have used the public buses, the lower their level of need and level of priority. It means that the public bus authority has to take into account those respondents, who have assigned low values to the level of need and level of priority, i.e., respondents that have lower age, lower education level, lower salary, and lower weekly frequency of using buses, and respondents with longer experience of using the public bus.
(4) Considering the priority factors in Table 3, price (F10), bus route (F3), easy access (F1), easy complaint (F20), and topping up (F11) are the important priority factors of bus e-ticket implementation as the analysis results of Simple Additive Weighting method.
These findings and recommendations overcome all research gaps in previous studies regarding the minimum number of respondents, preliminary survey to determine the factors, validity and reliability questionnaire to determine the factors, only in a small location of case studies, and further analysis method to determine important priority factors [1-10, 13-26, 29-34]. The most important thing of the results study, as consistently presented in conclusion, is that the bus e-ticket policy and the important priority factors could be implemented practically soon, because it is very beneficial to improve not only the public bus services in Surabaya and Denpasar, but also in other cities of Indonesia and in other developing countries that have similar traffic and geometric conditions.
| Qn | F1 | F2 | F3 | F4 | F5 | F6 | F7 | F8 | F9 | F10 |
|---|---|---|---|---|---|---|---|---|---|---|
| LN/LP | LN/LP | LN/LP | LN/LP | LN/LP | LN/LP | LN/LP | LN/LP | LN/LP | LN/LP | |
| Q1:G1 G2 |
4.1/4.0 4.0/3.7 |
3.9/4.0 3.9/3.7 |
4.0/4.0 4.0/3.8 |
3.9/3.9 4.0/3.7 |
3.9/3.9 3.9/3.7 |
3.9/3.9 3.9/3.5 |
4.0/4.0 3.9/3.7 |
3.9/3.8 3.8/3.6 |
3.9/3.9 3.9/3.7 |
4.0/4.1 4.0/3.8 |
| Q2:G1 G2 G3 G4 G5 |
4.2/4.2 4.2/3.9 4.0/3.5 3.7/3.4 3.4/3.7 |
4.1/4.1 3.9/3.8 3.7/3.7 3.7/3.4 3.3/3.7 |
4.2/4.2 4.1/3.9 3.9/3.7 3.7/3.5 3.8/3.5 |
4.1/4.0 4.1/3.9 3.8/3.6 3.6/3.3 3.6/3.3 |
4.1/4.1 4.0/3.8 3.8/3.7 3.6/3.4 3.4/3.3 |
4.1/4.0 3.9/3.5 3.8/3.6 3.6/3.3 3.6/3.5 |
4.1/4.1 3.9/3.7 4.0/3.7 3.7/3.3 3.6/3.7 |
4.1/4.0 3.9/3.7 3.6/3.6 3.5/3.3 3.2/3.1 |
4.1/4.0 4.0/3.8 3.7/3.7 3.6/3.3 3.2/3.2 |
4.1/4.2 4.0/3.9 3.9/3.8 3.9/3.5 3.5/3.5 |
| Q3:G1 G2 G3 G4 G5 |
3.3/3.7 4.0/3.9 4.2/4.1 4.2/3.8 4.2/3.9 |
3.3/3.7 3.7/3.7 3.9/4.1 3.8/3.8 4.1/4.0 |
4.1/4.3 3.8/4.1 4.1/4.1 4.1/4.0 4.2/4.0 |
3.3/3.7 3.9/4.0 4.0/4.0 4.0/3.7 4.1/3.8 |
3.1/3.4 3.9/3.8 3.9/4.0 3.9/3.8 4.2/4.0 |
3.4/3.5 3.6/3.9 3.9/3.9 4.0/3.4 4.2/3.8 |
3.3/3.8 3.9/3.7 4.0/4.1 3.9/3.7 4.2/3.9 |
3.1/3.5 3.7/3.6 3.8/3.9 3.8/3.5 4.1/3.8 |
2.8/3.9 3.7/3.8 3.9/4.0 4.0/3.8 4.2/3.9 |
3.8/3.9 3.8/4.1 4.0/4.1 3.9/3.9 4.2/4.0 |
| Q4:G1 G2 G3 G4 G5 |
3.9/4.1 4.0/3.9 4.2/3.9 4.2/3.8 4.1/3.8 |
3.8/4.0 3.7/3.9 4.0/3.8 4.1/3.9 4.0/3.8 |
3.9/4.2 4.0/4.0 4.0/3.8 4.2/3.9 4.2/3.8 |
3.8/4.1 3.9/3.8 4.0/3.8 4.0/3.8 4.2/3.5 |
3.8/3.9 3.8/3.8 4.0/3.8 4.1/3.9 4.1/3.4 |
3.8/4.0 3.8/3.8 3.9/3.7 4.0/3.6 4.0/3.7 |
3.8/4.0 3.9/3.9 4.0/3.7 4.0/3.7 4.2/3.9 |
3.7/3.8 3.7/3.7 3.9/3.8 4.0/3.7 3.9/3.6 |
3.7/4.1 3.7/3.8 3.9/3.8 4.1/3.9 4.1/3.5 |
4.0/4.2 3.8/4.0 4.1/4.0 4.1/3.8 4.1/3.3 |
| Q5:G1 G2 G3 G4 G5 |
4.0/3.9 4.3/4.1 4.3/4.2 3.9/3.5 4.1/3.7 |
3.8/3.9 4.1/4.0 4.2/4.1 3.7/3.8 3.8/3.7 |
3.9/4.0 4.2/4.0 4.4/4.1 4.0/3.6 3.9/3.8 |
3.9/3.9 4.2/4.0 4.2/4.1 3.9/3.7 3.9/3.5 |
3.9/3.8 4.2/4.0 4.3/4.2 3.7/3.5 3.9/3.8 |
3.8/3.8 4.2/3.9 4.1/3.9 3.8/3.7 3.8/3.5 |
3.9/3.8 4.2/4.1 4.2/4.0 3.9/3.8 3.8/3.6 |
3.7/3.7 4.1/4.0 4.1/4.0 3.5/3.6 3.7/3.6 |
3.8/3.9 4.2/4.0 4.2/4.1 3.6/3.8 3.7/3.5 |
4.0/4.0 4.2/4.2 4.2/4.1 3.9/3.8 4.0/3.7 |
| Q6:G1 G2 G3 G4 G5 |
4.3/4.2 3.9/3.8 4.1/3.6 4.1/3.7 4.0/3.8 |
4.1/4.2 3.8/3.7 3.8/3.8 3.8/3.8 3.9/3.7 |
4.3/4.3 3.9/3.8 4.0/3.6 3.9/3.9 3.8/3.7 |
4.1/4.1 3.9/3.7 4.0/3.7 3.9/3.6 3.9/3.9 |
4.1/4.2 3.9/3.7 3.9/3.6 3.8/3.9 3.9/4.0 |
4.0/4.1 3.9/3.6 3.9/3.6 3.8/3.6 3.8/3.7 |
4.1/4.1 3.8/3.7 4.0/3.7 4.0/3.8 3.9/3.7 |
4.0/4.0 3.8/3.7 3.8/3.6 3.7/3.7 3.8/3.7 |
4.0/4.1 3.8/3.7 3.8/3.7 3.9/3.9 3.8/3.9 |
4.1/4.1 4.0/3.9 4.0/3.8 3.6/4.0 4.1/4.0 |
| Q7:G1 G2 G3 G4 G5 |
3.9/4.0 4.1/4.0 4.1/3.8 4.1/3.7 4.6/4.2 |
3.9/3.9 3.9/4.0 3.8/3.8 4.0/3.9 4.4/4.2 |
4.0/4.1 4.0/4.2 4.0/3.8 4.1/3.8 4.4/4.3 |
3.9/4.0 4.0/4.0 4.0.3.8 4.0/3.7 4.4/4.1 |
3.8/3.9 4.0/4.0 3.9/3.8 4.0/3.7 4.4/4.3 |
3.9/3.9 3.9/4.0 3.9/3.7 3.9/3.6 4.4/4.1 |
4.0/3.9 4.0/4.1 4.0/3.8 4.0/3.7 4.4/4.2 |
3.7/3.8 3.7/3.8 3.8/3.8 3.9/3.7 4.0/3.7 |
3.8/3.9 3.8/4.0 3.9/3.8 3.9/3.7 4.0/3.7 |
4.0/4.0 4.1/4.1 4.0/4.1 4.0/3.8 4.5/4.2 |
| Q8:G1 G2 G3 G4 G5 |
4.2/4.1 4.0/4.0 4.0/3.9 4.0/3.8 4.1/3.7 |
4.1/4.1 3.9/4.0 3.8/3.9 3.8/3.7 3.8/3.7 |
4.2/4.3 4.1/4.2 4.1/3.8 4.0/3.8 3.9/3.8 |
4.1/4.1 4.1/4.0 4.0/3.8 4.0/3.8 3.8/3.7 |
4.1/4.1 4.0/3.9 3.9/3.8 4.0/3.7 3.8/3.8 |
4.0/4.1 3.8/3.9 3.9/3.7 3.9/3.7 3.8/3.6 |
4.2/4.0 3.8/3.9 3.9/3.9 4.0/3.8 3.9/3.7 |
4.0/3.9 3.8/3.8 3.9/3.8 3.9/3.7 3.7/3.6 |
4.1/4.1 3.8/3.8 3.9/3.8 3.9/3.7 3.7/3.8 |
4.1/4.1 4.0/4.1 4.0/4.1 4.1/3.9 4.0/3.9 |
| Q9:G1 G2 G3 G4 G5 |
3.9/4.0 4.5/4.4 4.2/3.9 3.9/3.6 4.1/3.6 |
3.6/3.9 4.3/4.4 4.0/4.0 3.7/3.7 3.9/3.7 |
3.7/4.2 4.4/4.4 4.1/3.9 3.9/3.7 4.1/3.9 |
3.5/3.8 4.4/4.3 4.1/3.8 3.9/3.6 3.9/3.5 |
3.5/3.7 4.4/4.2 4.1/3.9 3.8/3.7 4.0/3.6 |
3.8/3.6 4.2/4.3 4.1/3.7 3.8/3.5 4.0/3.6 |
3.6/3.9 4.3/4.4 4.0/3.9 3.9/3.7 4.0/3.5 |
3.7/3.6 4.4/4.2 4.0/3.9 3.6/3.6 3.9/3.1 |
3.6/3.7 4.4/4.4 4.1/3.9 3.7/3.6 3.8/3.4 |
3.8/4.1 4.5/4.3 4.0/4.0 4.0/3.8 4.0/3.6 |
Gn =group of question number n. Fn = factor number n. LN =level of need. LP = level of priority
| Qn | F11 | F12 | F13 | F14 | F15 | F16 | F17 | F18 | F19 | F20 |
|---|---|---|---|---|---|---|---|---|---|---|
| LN/LP | LN/LP | LN/LP | LN/LP | LN/LP | LN/LP | LN/LP | LN/LP | LN/LP | LN/LP | |
| Q1:G1 G2 |
4.0/4.0 3.9/3.7 |
3.9/3.9 3.9/3.6 |
3.8/3.8 3.8/3.6 |
3.9/3.9 3.9/3.7 |
3.9/3.9 3.9/3.7 |
4.0/3.9 3.9/3.7 |
3.7/3.7 3.7/3.5 |
3.9/3.9 3.9/3.7 |
3.8/3.7 3.8/3.6 |
3.9/4.0 3.9/3.7 |
| Q2:G1 G2 G3 G4 G5 |
4.2/4.1 4.0/3.9 3.8/3.7 3.8/3.4 3.1/3.5 |
4.1/4.0 3.9/3.7 3.8/3.6 3.6/3.4 3.3/3.0 |
4.0/4.0 3.9/3.6 3.8/3.5 3.4/3.2 3.4/3.5 |
4.1/4.0 3.9/3.7 3.9/3.7 3.7/3.3 3.2/3.6 |
4.1/4.0 3.9/3.8 3.7/3.7 3.6/3.3 3.2/3.4 |
4.1/4.1 3.9/3.7 3.8/3.6 3.6/3.4 3.6/3.6 |
3.8/3.8 3.9/3.6 3.5/3.5 3.5/3.2 3.7/3.5 |
4.1/4.0 4.0/3.9 3.7/3.6 3.7/3.4 3.9/3.8 |
4.0/3.9 3.9/3.7 3.7/3.7 3.5/3.3 3.2/3.1 |
4.1/4.1 4.1/3.9 3.7/3.6 3.6/3.5 3.3/3.2 |
| Q3:G1 G2 G3 G4 G5 |
3.3/3.7 3.9/3.9 4.0/4.1 3.9/3.7 4.3/4.0 |
2.9/3.5 3.8/3.8 3.9/3.9 3.9/3.8 4.1/3.8 |
3.7/3.5 3.7/3.7 3.8/3.9 3.9/3.4 4.1/3.7 |
3.4/3.6 3.9/3.9 4.0/4.0 3.9/3.8 4.1/3.7 |
3.3/3.7 3.7/3.9 3.9/4.0 3.9/3.7 4.2/3.9 |
3.3/3.6 3.7/3.8 3.9/4.0 3.9/3.8 4.2/3.8 |
3.7/3.4 4.0/3.8 3.7/3.7 3.7/3.4 3.9/3.7 |
3.4/3.9 3.9/4.0 3.9/4.0 3.7/3.5 4.2/3.9 |
3.2/3.6 3.6/3.7 3.9/3.8 3.5/3.3 4.0/3.8 |
3.9/3.7 3.9/3.9 4.0/4.0 3.9/3.9 4.2/4.1 |
| Q4:G1 G2 G3 G4 G5 |
3.8/4.1 3.8/3.9 4.0/3.9 4.1/3.8 4.2/3.7 |
3.8/4.0 3.8/3.8 3.9/3.8 4.0/3.7 4.0/3.5 |
3.8/4.0 3.6/3.8 3.9/3.6 3.9/3.6 4.0/3.5 |
3.9/4.1 3.8/3.8 4.0/3.8 4.0/3.7 4.0/3.7 |
3.8/4.0 3.7/3.9 4.0/3.8 4.0/3.7 4.0/3.8 |
3.9/4.1 3.8/3.9 4.0/3.8 3.9/3.6 4.1/3.8 |
3.8/3.9 3.6/3.6 3.8/3.6 3.6/3.5 4.1/3.7 |
3.8/4.1 3.8/3.8 3.9/3.9 4.0/3.7 4.1/3.7 |
3.7/3.9 3.7/3.6 3.9/3.7 3.9/3.7 4.0/3.5 |
3.9/4.0 3.9/3.8 4.0/4.0 4.1/3.8 3.9/3.8 |
| Q5:G1 G2 G3 G4 G5 |
3.8/3.9 4.3/4.2 4.3/4.2 3.8/3.7 3.8/3.6 |
3.8/3.8 4.1/4.0 4.2/4.0 3.7/3.7 3.8/3.5 |
3.7/3.8 4.1/3.9 4.1/3.9 3.8/3.5 3.8/3.4 |
3.9/3.9 4.2/4.1 4.2/4.0 3.8/3.6 3.8/3.5 |
3.8/3.9 4.2/4.0 4.3/4.0 3.6/3.6 3.7/3.5 |
3.7/3.9 4.2/4.1 4.2/4.0 3.8/3.7 3.9/3.5 |
3.6/3.7 4.0/3.8 3.8/3.8 3.7/3.6 3.5/3.4 |
3.8/3.9 4.2/4.1 4.2/4.2 3.8/3.6 3.8/3.6 |
3.7/3.6 4.2/4.0 4.1/4.1 3.8/3.6 3.7/3.5 |
3.8/3.9 4.3/4.1 4.3/4.2 3.8/3.6 3.8/3.6 |
| Q6:G1 G2 G3 G4 G5 |
4.0/4.2 3.9/3.8 3.9/3.8 4.0/3.8 3.9/3.9 |
4.0/4.0 3.9/3.6 3.9/3.8 3.8/3.6 3.9/3.9 |
4.0/4.0 3.7/3.5 3.9/3.5 3.7/3.6 3.8/3.7 |
4.1/4.1 3.9/3.6 3.9/3.7 3.8/3.6 4.0/4.0 |
4.1/4.1 3.8/3.6 3.8/3.8 3.8/3.6 4.0/3.9 |
4.1/4.1 3.8/3.7 3.9/3.7 3.8/3.6 4.0/3.8 |
3.8/3.9 3.6/3.5 3.7/3.6 3.7/3.3 3.7/3.5 |
4.0/4.1 3.8/3.7 3.9/3.7 3.8/3.8 4.0/4.0 |
3.9/4.0 3.8/3.6 3.8/3.6 3.6/3.5 3.9/3.7 |
4.0/4.1 3.9/3.8 4.0/3.7 3.9/3.7 3.9/4.0 |
| Q7:G1 G2 G3 G4 G5 |
3.9/4.0 4.0/4.0 3.9/3.9 4.0/3.8 4.5/4.2 |
3.8/3.9 3.9/4.0 3.9/3.7 4.0/3.7 3.9/4.2 |
3.9/3.8 4.0/4.1 3.8/3.6 3.9/3.6 3.9/4.2 |
3.8/4.0 4.0/4.1 3.9/3.8 3.9/3.7 3.9/3.7 |
3.8/3.9 3.8/4.0 3.9/3.7 4.0/3.8 4.4/4.2 |
3.9/4.0 3.9/4.0 3.9/3.8 3.9/3.7 4.4/4.1 |
3.6/3.8 3.7/3.8 3.7/3.6 3.8/3.5 3.8/4.2 |
3.9/3.9 4.0/4.1 3.9/3.8 3.9/3.8 4.4/4.2 |
3.8/3.7 4.0/3.7 3.8/3.7 3.8/3.7 4.4/4.2 |
3.8/4.0 4.0/4.0 3.9/3.9 3.9/3.7 4.4/4.2 |
| Q8:G1 G2 G3 G4 G5 |
4.1/4.1 4.0/3.9 4.0/4.0 4.0/3.8 3.8/3.8 |
4.1/4.0 3.8/3.9 3.8/3.8 3.9/3.7 3.8/3.7 |
4.0/4.0 3.9/3.8 3.8/3.8 3.8/3.6 3.7/3.5 |
4.1/4.0 3.9/3.9 3.9/3.9 3.9/3.7 3.9/3.8 |
4.1/4.0 3.8/4.0 3.9/3.9 3.9/3.7 3.8/3.7 |
4.1/4.1 3.8/3.8 3.9/3.9 3.9/3.7 3.9/3.7 |
3.7/3.9 3.6/3.7 3.8/3.7 3.7/3.5 3.7/3.5 |
4.0/4.0 3.8/3.9 3.9/3.9 3.8/3.7 3.9/3.7 |
3.9/3.9 3.8/3.6 3.9/3.7 3.8/3.6 3.7/3.6 |
4.1/4.1 4.0/4.0 3.9/3.9 3.9/3.7 3.9/3.8 |
| Q9:G1 G2 G3 G4 G5 |
3.5/3.9 4.4/4.5 4.1/4.0 3.8/3.6 4.1/3.4 |
3.5/3.7 4.2/4.3 4.1/3.9 3.8/3.7 3.9/3.2 |
3.5/3.7 4.2/4.3 4.0/3.8 3.8/3.7 3.8/3.3 |
3.7/3.7 4.3/4.4 4.1/3.9 3.8/3.6 3.9/3.5 |
3.5/3.8 4.4/4.4 4.0/3.9 3.8/3.7 3.8/3.4 |
3.7/3.9 4.3/4.4 4.1/3.9 3.8/3.5 3.8/3.2 |
3.3/3.7 4.1/4.0 3.8/3.7 3.7/3.7 3.6/3.3 |
3.5/3.9 4.4/4.3 4.0/3.9 3.8/3.6 4.0/3.6 |
3.6/3.9 4.2/4.2 4.0/3.8 3.7/3.6 3.8/3.4 |
3.7/3.9 4.3/4.5 4.0/4.0 3.8/3.8 4.1/3.5 |
Gn =group of question number n. Fn = factor number n. LN =level of need. LP = level of priority
| Respondents’ Demographic As Aspects of Analysis |
Preference Value of Priority Factors Based on Simple Additive Weighting Method |
|---|---|
| Gender | Priority 1: F10, Vi=3.34; F1, Vi=3.30; F3, Vi=3.30 Priority 2: F11, Vi=3.27; F20, Vi=3.26; F7, Vi=3.25; F2, Vi=3.24; F5, Vi=3.24; F4, Vi=3.23, F18, Vi=3.23; F9, Vi=3.22; F14, Vi=3.21; F15, Vi=3.20 Priority 3: F12, Vi=3.18; F6, Vi=3.17; F8, Vi=3.16; F13, Vi=3.13; F19, Vi=3.12 Priority 4: F17;Vi=3.05 |
| Age | Priority 1: F10, Vi=3.22; F3, Vi=3.20 Priority 2: F1, Vi=3.18; F18, Vi=3.17; F7, Vi=3.16; F2, Vi=3.14; F11, Vi=3.13; F20, Vi=3.33; F16, Vi=3.12; F4, Vi=3.11; F5, Vi=3.10; F14, Vi=3.10 Priority 3: F15, Vi=3.08; F6, Vi=3.07; F9, Vi=3.07; F12, Vi=3.03; F13, Vi=3.03; F8, Vi=3.00 Priority 4: F17, Vi=2.99; F19, Vi=2.99 |
| Education | Priority 1: F3, Vi=3.41; F10, Vi=3.30; F20, Vi=3.30 Priority 2: F1, Vi=3.29; F11, Vi=3.25; F7, Vi=3.23; F18, Vi=3.23; F4, Vi=3.22; F9, Vi=3.22; F14, Vi=3.22; F2, Vi=3.21 Priority 3: F5, Vi=3.19; F15, Vi=3.19; F16, Vi=3.19; F12, Vi=3.15; F6, Vi=3.14; F13, Vi=3.13 Priority 4: F8, Vi=3.08; F17, Vi=3.08; F19, Vi=3.07 |
| Salary | Priority 1: F3, Vi=3.34; F1, Vi=3.33 Priority 2: F10, Vi=3.29; F11, Vi=3.29; F2, Vi=3.28; F7, Vi=3.28; F20, Vi=3.28; F4, Vi=3.25; F16, Vi=3.25; F14, Vi=3.24; F15, Vi=3.24; F18, Vi=3.24; F9, Vi=3.23; F5, Vi=3.22 Priority 3: F6, Vi=3.19; F12, Vi=3.19; F8, Vi=3.16; F13, Vi=3.15; F19, Vi=3.14; F17, Vi=3.10 |
| Purpose of using the bus | Priority 1: F10, Vi=3.36; F3, Vi=3.33; F1, Vi=3.32; F11, Vi=3.31 Priority 2: F7, Vi=3.29; F20, Vi=3.29; F2, Vi=3.28; F5, Vi=3.28; F4, Vi=3.27; F9, Vi=3.26; F18, Vi=3.26; F16, Vi=3.25; F14, Vi=3.24; F15, Vi=3.24; F12, Vi=3.23; F6, Vi=3.21 Priority 3: F8, Vi=3.19; F19, Vi=3.18; F13, Vi=3.17 Priority 4: F17, Vi=3.08 |
| Weekly frequency of using the bus | Priority 1: F10, Vi=3.34 Priority 2: F1, Vi=3.28; F3, Vi=3.28; F5, Vi=3.28; F11, Vi=3.28; F18, Vi=3.26; F20, Vi=3.26; F9, Vi=3.24; F2, Vi=3.23; F4, Vi=3.23; F7, Vi=3.243; F14, Vi=3.23; F15, Vi=3.21; F16, Vi=3.21; F12, Vi=3.20 Priority 3: F6, Vi=3.16; F8, Vi=3.16; F13, Vi=3.13; F19, Vi=3.12 Priority 4: F17, Vi=3.02 |
| Reason for using the bus | Priority 1: F3, Vi=3.41; F10, Vi=3.41 Priority 2: F1, Vi=3.38; F11, Vi=3.37; F20, Vi=3.35; F2, Vi=3.34; F5, Vi=3.34; F7, Vi=3.34; F18, Vi=3.34; F4, Vi=3.33; F15, Vi=3.32; F16, Vi=3.32 Priority 3: F6, Vi=3.39; F12, Vi=3.37; F13, Vi=3.25; F14, Vi=3.25; F9, Vi=3.24; F19, Vi=3.24 Priority 4: F8, Vi=3.18; F17, Vi=3.15 |
| Long time of using bus | Priority 1: F10, Vi=3.37; F3, Vi=3.35; F1, Vi=3.33; F11, Vi=3.31; F20, Vi=3.30 Priority 2: F4, Vi=3.29; F7, Vi=3.28; F2, Vi=3.27; F5, Vi=3.27; F14, Vi=3.26; F15, Vi=3.25; F16, Vi=3.25; F18, Vi=3.25; F9, Vi=3.24; F12, Vi=3.22; F6, Vi=3.21; Priority 3: F8, Vi=3.18; F13, Vi=3.18; F19, Vi=3.14 Priority 4: F17, Vi=3.08 |
| Mode of transportation before using the bus | Priority 1: F3, Vi=3.39; F10, Vi=3.36; F1, Vi=3.34; F20, Vi=3.30 Priority 2: F2, Vi=3.29; F7, Vi=3.29; F11, Vi=3.29; F18, Vi=3.27; F5, Vi=3.25; F14, Vi=3.25; F4, Vi=3.24; F9, Vi=3.24; F16, Vi=3.24; F15, Vi=3.23; F6, Vi=3.22 Priority 3: F19, Vi=3.18; F12, Vi=3.17; F8, Vi=3.16; F13, Vi=3.16 Priority 4: F17, Vi=3.07 |
 is a preference value of priority factors of bus e ticket to be implemented
CONCLUSION
A study covering the policy of bus e-ticket system implementation is needed and prioritized based on the opinions of the bus passengers as respondents. It is also critical in improving public bus services. Cross tabulation analysis and Simple Additive Weighting statistical methods produce more details about the important priority factors of bus e-ticket implementation that are required and their priorities are based on the respondents’ demographics. The three highest values of important priority factors are ease of access to the e-ticket system information, availability of the bus routes information when purchasing an e-ticket, and affordability of the e-ticket price.
The study is not only essential for the two large cities as the case studies but can also be used to improve public bus services in other large cities in Indonesia and other developing countries with similar conditions. The results are definitely very beneficial for public bus authorities in the large cities to determine the implementation of a bus e-ticket system as a transport policy for public bus transportation. This is because of the strict application of research methodology steps i.e., large data set above minimum sample size, preliminary survey to determine the factors, application of Pearson Moment and Alpha Cronbach statistical methods to develop a valid and reliable questionnaire, research survey in two large cities, cross tabulation analysis to present detailed transport policies to improve the public bus service, and using Simple Additive Weighting method to provide the important priority factors of bus e-ticket implementation.
Moreover, using the research questionnaire, further studies in other cities can produce similar datasets as well. Then, the results in this study can be compared to other results to provide better public bus services.
Since the study that governs the implementation of the e-ticket is significant and required, the system can have a potentially good impact on the society, wherein in the future, the more the society uses the public bus transportation because it provides a better service, the lesser the traffic congestion will be and the lesser the transport pollution emissions produced from the vehicles. This condition supports and leads to the sustainability and resilience of the cities.
CONSENT FOR PUBLICATION
Not applicable.
AVAILABILITY OF DATA AND MATERIALS
Not applicable.
FUNDING
None.
CONFLICT OF INTEREST
The author declares no conflict of interest, financial or otherwise.
ACKNOWLEDGEMENTS
The author expresses her gratitude to the Ministry of Technology, Research, and Higher education, Republic of Indonesia and Research and Service to Community Bureau at the Parahyangan Catholic University for their support in the data collection process.
APPENDIX
| Fn | Factors | Value of Pearson Moment rcount |
Validation test results r table α=5% = 0.361 |
Value of Alpha Cronbach α α > 0.70 → reliable |
|---|---|---|---|---|
| Surabaya Denpasar | Surabaya Denpasar | |||
| F1 | Ease of access to information on the e-ticket | 0.50 0.51 | valid | 0.83 0.84 |
| F2 | Information availability on the bus schedules, while buying the e-ticket | 0.51 0.52 | valid | 0.84 0.84 |
| F3 | Information availability on bus routes, while buying the e-ticket | 0.50 0.52 | valid | 0.83 0.84 |
| F4 | Ease of access to the e-ticket service | 0.50 0.52 | valid | 0.81 0.84 |
| F5 | Consistency of e-ticket service schedule | 0.49 0.52 | valid | 0.83 0.85 |
| F6 | Cleanliness of the e-ticket sales location | 0.48 0.52 | valid | 0.82 0.85 |
| F7 | Security at the e-ticket sales location | 0.50 0.52 | valid | 0.82 0.85 |
| F8 | Availability of the e-ticket service at each sales location | 0.48 0.52 | valid | 0.83 0.85 |
| F9 | Speed of e-ticket sales | 0.50 0.52 | valid | 0.82 0.84 |
| F10 | Affordability of the e-ticket price | 0.51 0.51 | valid | 0.84 0.84 |
| F11 | Ease of topping up (recharging) the e-ticket | 0.49 0.53 | valid | 0.83 0.85 |
| F12 | Service of the operator to the passengers, when they buy the e-ticket | 0.50 0.53 | valid | 0.83 0.85 |
| F13 | Hospitality of the operator towards the passengers, when they buy the e-ticket | 0.50 0.52 | valid | 0.83 0.85 |
| F14 | Experience/skill of the operator in informing the passengers about the e-ticket | 0.50 0.52 | valid | 0.83 0.85 |
| F15 | Ease of tapping-in and tapping-out of the e-ticket at the corridor | 0.50 0.52 | valid | 0.83 0.85 |
| F16 | Convenience of the passengers, while in queue to buy the e-ticket | 0.48 0.52 | valid | 0.82 0.85 |
| F17 | Distance between the e-ticket sales location and the entry door of the bus | 0.50 0.52 | valid | 0.83 0.85 |
| F18 | Ease of finding the e-ticket sales location | 0.50 0.52 | valid | 0.83 0.85 |
| F19 | Quality of the e-ticket card | 0.49 0.52 | valid | 0.83 0.85 |
| F20 | Ease of lodging complains about the e-ticket system | 0.50 0.52 | valid | 0.83 0.85 |
Legend: ttable α=5% = 1.697  tcount Surabaya = 2.693 > 1.697 →valid tcount Denpasar = 2.757 > 1.697 →valid tcount Surabaya = 2.693 > 1.697 →valid tcount Denpasar = 2.757 > 1.697 →validAlpha Cronbach  k = number of questions in scale = 5; n = number of respondents = 30 k = number of questions in scale = 5; n = number of respondents = 30Pearson Moment  and rtable α =5%= 0.361 and rtable α =5%= 0.361 |
||||
| Field data collection | Number of bus passengers in Surabaya | Number of bus passengers in Denpasar |
| Population of bus passengers per day (N) | 31,131 | 2,048 |
Required sample size (n) with  and e = 10% [35] and e = 10% [35] |
100 | 96 |
| Number of respondents at each location | 429 | 136 |
| Total number of respondents | 565 | |
| Qn | Question | Group 1 | Group 2 | Group 3 | Group 4 | Group 5 |
|---|---|---|---|---|---|---|
| Q1 | Gender Surabaya Denpasar |
Male | Female | |||
| 228 (53%) 77 (57%) |
201 (47%) 59 (43%) |
|||||
| Q2 | Age (years) Surabaya Denpasar |
< 25 | 26 – 35 | 36 – 45 | 46 – 55 | > 55 |
| 178 (41%) 46 (34%) |
124 (29%) 3 (2%) |
86 (20%) 25 (18%) |
30 (7%) 31 (23%) |
11 (3%) 31 (23%) |
||
| Q3 | Latest education Surabaya Denpasar |
Primary school |
Secondary school |
High school | Vocational school |
Higher education |
| 3 (1%) 22 (16%) |
13 (3%) 35 (26%) |
151 (35%) 47 (35%) |
76 (18%) 3 (2%) |
186 (43%) 29 (21%) |
||
| Q4 | Salary (USD) Surabaya Denpasar |
< 67 | 67 – 167 | 167 – 334 | 334 – 670 | > 670 |
| 36 (8%) 33 (24%) |
98 (23%) 3 (2%) |
159 (37%) 49 (36%) |
104 (24%) 32 (24%) |
32 (8%) 19 (14%) |
||
| Q5 | Purpose of using the bus Surabaya Denpasar |
Work | Education | Tourism | Daily activity | Emergencies |
| 105 (24%) 50 (37%) |
120 (28%) 23 (17%) |
70 (16%) 12 (9%) |
50 (12%) 20 (14%) |
84 (20%) 31 (23%) |
||
| Q6 | Weekly frequency Surabaya Denpasar |
Once | 1 – 2 times | 3 – 4 times | 5 – 6 times | 7 or more times |
| 117 (27%) 29 (21%) |
153 (36%) 46 (34%) |
77 (18%) 40 (29%) |
23 (5%) 16 (12%) |
59 (14%) 5 (4%) |
||
| Q7 | Reason for choosing the bus Surabaya Denpasar |
No personal vehicle | Faster travel time | Economy | Safety | Security |
| 51 (12%) 36 (27%) |
44 (10%) 12 (9%) |
186 (43%) 50 (37%) |
79 (19%) 37 (27%) |
69 (16%) 1 (0%) |
||
| Q8 | Long time of using bus Surabaya Denpasar |
< 1 month | 1 – 6 months | 6 months - 1 year | 1 – 2 years | > 2 years |
| 47 (11%) 31 (23%) |
33 (8%) 19 (14%) |
70 (16%) 25 (18%) |
66 (15%) 40 (30%) |
213 (50%) 21 (15%) |
||
| Q9 | Mode of transportation before using the bus Surabaya Denpasar |
Walking | Passenger car | Motorcycle | Paratransit/ online service | Taxi |
| 5 (1%) 25 (18%) |
111 (26%) 8 (6%) |
185 (43%) 32 (24%) |
114 (27%) 60 (44%) |
14 (3%) 11 (8%) |
| Fn | Statement | Surabaya Bus E-Ticket | Denpasar Bus E-Ticket | ||
|---|---|---|---|---|---|
| Level of Need | Level of Priority | Level of Need | Level of Priority | ||
| F1 | Ease of access to information on the e-ticket | 1. 7 (2%) | a. 6 (1%) | 1. 0 (0%) | a. 0 (0%) |
| 2. 17 (4%) | b. 46 (11%) | 2. 2 (1%) | b. 1 (1%) | ||
| 3. 74 (17%) | c. 108 (25%) | 3. 32 (24%) | c. 33 (24%) | ||
| 4. 134 (31%) | d. 200 (47%) | 4. 68 (50%) | d. 65 (48%) | ||
| 5. 197 (46%) | e. 169 (16%) | 5. 34 (25%) | e. 37 (27%) | ||
| F2 | Information availability on the bus schedules, while buying the e-ticket | 1. 5 (1%) | a. 5 (1%) | 1. 0 (0%) | a. 0 (0%) |
| 2. 21 (5%) | b. 32 (8%) | 2. 1 (1%) | b. 0 (0%) | ||
| 3. 156 (37%) | c. 132 (31%) | 3. 29 (21%) | c. 37 (27%) | ||
| 4. 165 (38%) | d. 186 (43%) | 4. 69 (51%) | d. 62 (46%) | ||
| 5. 82 (19%) | e. 74 (17%) | 5. 37 (27%) | e. 37 (27%) | ||
| F3 | Information availability on bus routes, while buying the e-ticket | 1. 6 (1%) | a. 4 (1%) | 1. 0 (0%) | a. 0 (0%) |
| 2. 25 (6%) | b. 40 (9%) | 2. 0 (0%) | b. 27 (20%) | ||
| 3. 106 (25%) | c. 133 (31%) | 3. 20 (15%) | c. 71 (52%) | ||
| 4. 167 (39%) | d. 168 (39%) | 4. 76 (56%) | d. 38 (28%) | ||
| 5. 125 (29%) | e. 84 (20%) | 5. 40 (29%) | e. 38 (28%) | ||
| F4 | Ease of access to the e-ticket service | 1. 4 (1%) | a. 7 (2%) | 1. 0 (0%) | a. 0 (0%) |
| 2. 27 (6%) | b. 38 (9%) | 2. 0 (0%) | b. 0 (0%) | ||
| 3. 108 (25%) | c. 144 (34%) | 3. 30 (22%) | c. 48 (35%) | ||
| 4. 176 (41%) | d. 147 (33%) | 4. 68 (50%) | d. 51 (38%) | ||
| 5. 114 (27%) | e. 93 (22%) | 5. 38 (28%) | e. 37 (27%) | ||
| F5 | Consistency of e-ticket service schedule | 1. 5 (1%) | a. 4 (1%) | 1. 0 (0%) | a. 0 (0%) |
| 2. 33 (8%) | b. 37 (9%) | 2. 0 (0%) | b. 0 (0%) | ||
| 3. 117 (27%) | c. 134 (31%) | 3. 34 (25%) | c. 50 (37%) | ||
| 4. 158 (37%) | d. 167 (39%) | 4. 61 (45%) | d. 47 (34%) | ||
| 5. 116 (27%) | e. 87 (20%) | 5. 41 (30%) | e. 39 (29%) | ||
| F6 | Cleanliness of the e-ticket sales location | 1. 7 (1%) | a. 4 (1%) | 1. 0 (0%) | a. 0 (0%) |
| 2. 18 (4%) | b. 43 (10%) | 2. 0 (0%) | b. 0 (0%) | ||
| 3. 123 (29%) | c. 161 (38%) | 3. 37 (27%) | c. 63 (46%) | ||
| 4. 179 (42%) | d. 130 (30%) | 4. 65 (48%) | d. 40 (30%) | ||
| 5. 102 (24%) | e. 91 (21%) | 5. 34 (25%) | e. 33 (24%) | ||
| F7 | Security at the e-ticket sales location | 1. 4 (1%) | a. 3 (1%) | 1. 0 (0%) | a. 0 (0%) |
| 2. 31 (7%) | b. 35 (8%) | 2. 0 (0%) | b. 0 (0%) | ||
| 3. 128 (30%) | c. 159 (37%) | 3. 30 (22%) | c. 47 (35%) | ||
| 4. 156 (36%) | d. 144 (34%) | 4. 61 (45%) | d. 47 (35%) | ||
| 5. 110 (26%) | e. 88 (20%) | 5. 45 (33%) | e. 42 (30%) | ||
| F8 | Availability of the e-ticket service at each sales location | 1. 4 (1%) | a. 7 (2%) | 1. 0 (0%) | a. 0 (0%) |
| 2. 36 (9%) | b. 33 (8%) | 2. 0 (0%) | b. 3 (2%) | ||
| 3. 113 (26%) | c. 113 (26%) | 3. 3 (2%) | c. 61 (45%) | ||
| 4. 146 (34%) | d. 180 (42%) | 4. 60 (44%) | d. 50 (37%) | ||
| 5. 130 (30%) | e. 96 (22%) | 5. 24 (18%) | e. 22 (16%) | ||
| F9 | Speed of e-ticket sales | 1. 5 (1%) | a. 3 (1%) | 1. 0 (0%) | a. 0 (0%) |
| 2. 25 (6%) | b. 36 (8%) | 2. 0 (0%) | b. 1 (1%) | ||
| 3. 106 (25%) | c. 114 (27%) | 3. 42 (31%) | c. 55 (40%) | ||
| 4. 172 (40%) | d. 171 (40%) | 4. 71 (52%) | d. 50 (37%) | ||
| 5. 121 (28%) | e. 105 (24%) | 5. 23 (17%) | e. 30 (22%) | ||
| F10 | Affordability of the e-ticket price | 1. 6 (1%) | a. 3 (1%) | 1. 0 (0%) | a. 0 (0%) |
| 2. 19 (5%) | b. 30 (7%) | 2. 1 (1%) | b. 1 (0%) | ||
| 3. 114 (27%) | c. 119 (28%) | 3. 21 (15%) | c. 31 (23%) | ||
| 4. 168 (39%) | d. 159 (37%) | 4. 73 (54%) | d. 66 (49%) | ||
| 5. 122 (28%) | e. 118 (27%) | 5. 41 (30%) | e. 38(28%) | ||
| F11 | Ease of topping up (recharging) the e-ticket | 1. 6 (1%) | a. 5 (1%) | 1. 0 (0%) | a. 0 (0%) |
| 2. 27 (6%) | b. 27 (6%) | 2. 0 (0%) | b. 0 (0%) | ||
| 3. 101 (24%) | c. 115 (27%) | 3. 36 (26%) | c. 53 (39%) | ||
| 4. 188 (44%) | d. 166 (39%) | 4. 58 (43%) | d. 48 (35%) | ||
| 5. 107 (25%) | e. 116 (27%) | 5. 42 (31%) | e. 35 (26%) | ||
| F12 | Service of the operator to the passengers, when they buy the e-ticket | 1. 3 (1%) | a. 5 (1%) | 1. 0 (0%) | a. 0 (0%) |
| 2. 26 (6%) | b. 23 (5%) | 2. 0 (0%) | b. 0 (0%) | ||
| 3. 126 (29%) | c. 157 (37%) | 3. 39 (29%) | c. 59 (43%) | ||
| 4. 181 (42%) | d. 158 (37%) | 4. 64 (47%) | d. 47 (35%) | ||
| 5. 93 (22%) | e. 86 (20%) | 5. 33 (24%) | e. 30 (22%) | ||
| F13 | Hospitality of the operator towards the passengers, when they buy the e-ticket | 1. 3 (1%) | a. 3 (1%) | 1. 0 (0%) | a. 0 (0%) |
| 2. 18 (4%) | b. 31 (7%) | 2. 0 (0%) | b. 0 (0%) | ||
| 3. 136 (32%) | c. 158 (37%) | 3. 43 (32%) | c. 71 (52%) | ||
| 4. 178 (41%) | d. 155 (36%) | 4. 68 (50%) | d. 38 (28%) | ||
| 5. 94 (22%) | e. 82 (9%) | 5. 25 (18%) | e. 27 (20%) | ||
| F14 | Experience/skill of the operator in informing the passengers about the e-ticket | 1. 6 (1%) | a. 3 (1%) | 1. 0 (0%) | a. 0 (0%) |
| 2. 25 (6%) | b. 28 (7%) | 2. 0 (0%) | b. 0 (0%) | ||
| 3. 101 (24%) | c. 156 (36%) | 3. 36 (26%) | c. 56 (41%) | ||
| 4. 197 (46%) | d. 152 (35%) | 4. 64 (47%) | d. 45 (33%) | ||
| 5. 100 (23%) | e. 90 (21%) | 5. 36 (27%) | e. 35 (26%) | ||
| F15 | Ease of tapping-in and tapping-out of the e-ticket at the corridor | 1. 4 (1%) | a. 3 (1%) | 1. 0 (0%) | a. 0 (0%) |
| 2. 19 (4%) | b. 29 (7%) | 2. 0 (0%) | b. 0 (0%) | ||
| 3. 137 (32%) | c. 137 (32%) | 3. 40 (30%) | c. 61 (45%) | ||
| 4. 187 (44%) | d. 162 (37%) | 4. 59 (43%) | d. 42 (31%) | ||
| 5. 82 (19%) | e. 98 (23%) | 5. 37 (27%) | e. 33 (24%) | ||
| F16 | Convenience of the passengers, while in queue to buy the e-ticket | 1. 3 (1%) | a. 6 (1%) | 1. 0 (0%) | a. 0 (0%) |
| 2. 32 (7%) | b. 28 (7%) | 2. 0 (0%) | b. 0 (0%) | ||
| 3. 125 (29%) | c. 150 (35%) | 3. 39 (29%) | c. 53 (39%) | ||
| 4. 166 (39%) | d. 164 (38%) | 4. 56 (41%) | d. 46 (34%) | ||
| 5. 103 (24%) | e. 81 (19%) | 5. 41 (30%) | e. 37 (27%) | ||
| F17 | Distance between the e-ticket sales location and the entry door of the bus | 1. 4 (1%) | a. 5 (1%) | 1. 0 (0%) | a. 0 (0%) |
| 2. 25 (6%) | b. 39 (9%) | 2. 1 (1%) | b. 0 (0%) | ||
| 3. 161 (37%) | c. 162 (38%) | 3. 60 (44%) | c. 78 (57%) | ||
| 4. 153 (36%) | d. 146 (34%) | 4. 52 (38%) | d. 38 (28%) | ||
| 5. 86 (20%) | e. 77 (18%) | 5. 23 (17%) | e. 20 (15%) | ||
| F18 | Ease of finding the e-ticket sales location | 1. 7 (2%) | a. 4 (1%) | 1. 0 (0%) | a. 0 (0%) |
| 2. 22 (5%) | b. 25 (6%) | 2. 0 (0%) | b. 0 (0%) | ||
| 3. 110 (25%) | c. 138 (32%) | 3. 38 (28%) | c. 53 (39%) | ||
| 4. 187 (44%) | d. 162 (38%) | 4. 67 (49%) | d. 52 (38%) | ||
| 5. 103 (24%) | e. 100 (23%) | 5. 31 (23%) | e. 31 (23%) | ||
| F19 | Quality of the e-ticket card | 1. 4 (1%) | a. 4 (1%) | 1. 0 (0%) | a. 0 (0%) |
| 2. 23 (5%) | b. 33 (8%) | 2. 0 (0%) | b. 0 (0%) | ||
| 3. 131 (31%) | c. 146(34%) | 3. 53 (39%) | c. 76 (56%) | ||
| 4. 185 (43%) | d. 162 (37%) | 4. 52 (38%) | d. 31 (23%) | ||
| 5. 86 (20%) | e. 84 (20%) | 5. 31 (23%) | e. 29 (21%) | ||
| F20 | Ease of lodging complains about the e-ticket system | 1. 3 (1%) | a. 5 (1%) | 1. 0 (00%) | a. 0 (00%) |
| 2. 27 (6%) | b. 25 (6%) | 2. 0 (00%) | b. 0 (00%) | ||
| 3. 113 (26%) | c. 135 (31%) | 3. 39 (29%) | c. 46 (34%) | ||
| 4. 191 (45%) | d. 184 (43%) | 4. 56 (41%) | d. 49 (36%) | ||
| 5. 95 (22%) | e. 80 (19%) | 5. 41 (30%) | e. 41 (30%) | ||
| Legend: | 1 = Least needed 2 = Not needed 3 = Fairly needed 4 = Needed 5 = Most needed |
a = Least priority b = Not a priority c = Fair priority d = Priority e = Most priority |
|||
| Fn | Bus e-ticket implementation | Surabaya | Denpasar | Average | |||
|---|---|---|---|---|---|---|---|
| LN | LP | LN | LP | LN | LP | ||
| F1 | Ease of access to information on the e-ticket | 4.16 | 3.65 | 3.99 | 4.01 | 4.08 | 3.83 |
| F2 | Information availability on the bus schedules while buying the e-ticket | 3.69 | 3.68 | 4.04 | 4.00 | 3.87 | 3.84 |
| F3 | Information availability on bus routes while buying the e-ticket | 3.89 | 3.67 | 4.15 | 4.08 | 4.02 | 3.88 |
| F4 | Ease of access to the e-ticket service | 3.86 | 3.66 | 4.06 | 3.92 | 3.96 | 3.79 |
| F5 | Consistency of e-ticket service schedule | 3.81 | 3.61 | 4.05 | 3.92 | 3.93 | 3.77 |
| F6 | Cleanliness of the e-ticket sales location | 3.82 | 3.61 | 3.98 | 3.78 | 3.90 | 3.70 |
| F7 | Security at the e-ticket sales location | 3.79 | 3.65 | 4.11 | 3.96 | 3.95 | 3.81 |
| F8 | Availability of the e-ticket service at each sales location | 3.84 | 3.76 | 3.77 | 3.67 | 3.81 | 3.72 |
| F9 | Speed of e-ticket sales | 3.88 | 3.79 | 3.86 | 3.80 | 3.87 | 3.80 |
| F10 | Affordability of the e-ticket price | 3.89 | 3.89 | 4.13 | 4.04 | 4.01 | 3.97 |
| F11 | Ease of topping up (recharging) the e-ticket | 3.84 | 3.84 | 4.04 | 3.87 | 3.94 | 3.86 |
| F12 | Service of the operator to the passengers, when they buy the e-ticket | 3.78 | 3.69 | 3.96 | 3.79 | 3.87 | 3.74 |
| F13 | Hospitality of the operator towards the passengers, when they buy the e-ticket | 3.80 | 3.66 | 3.87 | 3.68 | 3.84 | 3.67 |
| F14 | Experience/skill of the operator in informing the passengers about the e-ticket | 3.84 | 3.69 | 4.00 | 3.85 | 3.92 | 3.77 |
| F15 | Ease of tapping-in and tapping-out of the e-ticket at the corridor | 3.76 | 3.75 | 3.98 | 3.79 | 3.87 | 3.77 |
| F16 | Convenience of the passengers while in the queue to buy the e-ticket | 3.78 | 3.67 | 4.01 | 3.88 | 3.90 | 3.78 |
| F17 | Distance between the e-ticket sales location and the entry door of the bus | 3.68 | 3.59 | 3.71 | 3.57 | 3.70 | 3.58 |
| F18 | Ease of finding the e-ticket sales location | 3.83 | 3.83 | 3.95 | 3.84 | 3.89 | 3.84 |
| F19 | Quality of the e-ticket card | 3.76 | 3.67 | 3.84 | 3.65 | 3.80 | 3.66 |
| F20 | Ease of lodging complains about the e-ticket system | 3.81 | 3.72 | 4.01 | 3.96 | 3.91 | 3.84 |

