All published articles of this journal are available on ScienceDirect.

Evaluation of Back of Queue at Signalized Intersections in Erbil City Using Different Software
Abstract
Aims:
The aim of this study is to evaluate the queue length of isolated signalized intersections, which used HCS2010 and SIDRA Intersection 8 traffic software.
Background:
One of the important parameters to evaluate the performance of a traffic management system is queue length, especially in congested traffic situations. For the estimation of back of queue length, many traffic analyzing models are used based on Highway Capacity Manual (HCM2010).
Objective:
The values of queue length obtained from these two softwares are to be compared with observed queue length from the field. The study also aids in conducting a model of optimization for the back of queue length to decrease the value of storage length of vehicles following the GA procedure.
Methods:
In this study, four isolated signalized intersections were used in Erbil city, the capital of the Iraqi Kurdistan Region. The values of the measured back of queue lengths are compared with the values obtained from Highway Capacity Software HCS2010(HCS+T7F) and Signalized and Unsignalized Intersection Design and Research (SIDRA Intersection 8) Aid Australian Road Research Board (ARRB) software.
Results and Discussion:
The results of regression analysis showed that the SIDRA Intersection 8 Back of Queue model with adjusted R2 0.8465 have a stronger relationship with the field measured Back of the Queue for linear relationship compared to the HCS2010 back of queue model. Furthermore, the study tends to optimize the signalized intersections under study using HCS2010 and SIDRA Intersection 8 software based on the Genetic Algorithm (GA) to minimize the back of queue length. The percent of average reduction in HCS2010 and SIDRA Intersection 8 back of queue models are 36% and 29%, respectively. The main objective of optimizing the timing plan was to minimize the average storage queue length at signalized intersections that follow the Highway Capacity Manual (TRB 2010) procedure for queue length calculation. Moreover, 95th and 98th values of the percentiles were chosen to estimate the expectancy of upstream lane blockage and the expectancy of short lane overflow that was related to the back of the queue percentile.
Conclusion:
The improvement of vehicle storage for upstream lanes was conducted by the two software systems mentioned before. The results showed significant improvement in the performance of the intersections under study with a reduction in queue length.
1. INTRODUCTION
Queue length is an important measure of signalized intersection performance. Queue lengths greater than the available storage space for close-located intersections and turning movements unfavorable influence the intersection's general operation and performance.
Scholars and researchers have distinguished that the vehicular queue length is necessary for both signal optimization and signal performance estimation of automobile stops and delays. Many scholars and researchers have allocated themselves to the purpose of prediction and minimization of queue length using various methods that have been formulated [1].
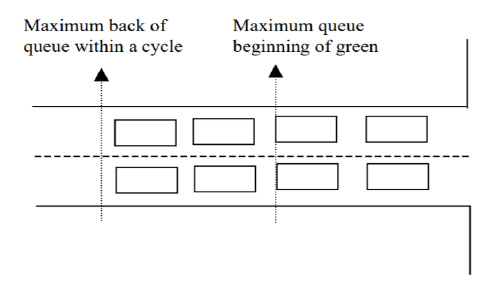
Queue at signalized intersection approaches has two forms, the first is the queue length and the other is the maximum Back of the queue as described in Highway Capacity Manual2000 and 2010 [2, 3]. The queue length that has been observed from the stop line to the tail of the queue at the end of red time is called queue length. While the maximum distance from the stop line to the last queued vehicle when the queue disperses is called the back of the queue, as shown in Fig. (1).
For practical implementation, sometimes the [4] mathematical models are often suitable and theoretical as part of an algorithm program for the signalized traffic control. So, the significant studies have been dedicated to researching on the vehicle queues forming process at the approach of insulated signalized intersections [5, 6], also, the main street elements in the city [7, 8]. Furthermore, studies have been conducted frequently for research on more precise method than before for traffic control using adaptive signal lighting [9-11] or analysis of network, addressing the problem of choosing the optimal trajectory of the vehicle speed on a signalized arterial considering the vehicle queue [12-15]; moreover, microscopic simulation works for signalized intersections [16-18].
Updated proposals with validations of models that used to estimate queue length at signalized intersections are presented [19-22].
Often, queue length models at signalized intersections are part of complex virtual reality models on the process of simulated traffic roads [23-25].
In 2009, a study on an innovated model made to evaluate the queue length at a signalized intersection using detectors. They applied Lighthill–Whitham–Richards (LWR) shockwave theory that will be able to assess the queue length under congested conditions and various traffic states at the intersection. In this paper, three models (Basic model, Expansion I, and Expansion II) were used to estimate the queue length through comparing the calculated maximum queue length with the field observed data recorded by manual count method and video camera recorder technique. The results showed that the most accurate model is basic model, and the other model is acceptable, too [1].
Back of queue length and queue length have a great impact on the delay time at pretimed signalized intersections [26].
The TRB Committee of the Highway Capacity and Quality of Service has suggested a particular queue-length approach for the Highway Capacity Manual (HCM2000) to standardize the methodology for queue length analysis [3]. In Australia, Akçelik used the Signalized and Un-signalized Intersection Design and Research Aid, a software called (SIDRA) program to develop this approach [27], the structure of the HCM2000 method improved for signalized intersection analysis in Australia [28].
Queue length fundamental concepts were introduced in a study [29, 30]. Their studies provided the basis for the development of different approaches for estimating queue lengths at signalized intersections, including the protection equation [31], the shockwave theory [32, 33], the probe vehicle approach [34, 35], and the input-output technique [36].
A method was proposed in 2011 [35] based on shock waves to evaluate queue length at signalized intersections. Their approach used vehicle trajectory samples to assess queue length cycle by cycle for signalized intersections. Three data sets (simulated data set, NGSIM data set, and field collected GPS data set) are utilized to determine the cycle-by-cycle queue length. The results of the study showed that this trajectory-based method is promising.
Several queue length software used to determine the Qqeue length at the signalized intersection, and then compared the results of these software with each other. The software systems used in the paper are SIDRA 5.2, NETSIM (as implemented in CORSIM), TRANSYT-7F, SOAP, SIGNAL 97, and the proposed Highway Capacity Manual (HCM) 2000 Queue model. The results of the study indicated that the results of HCM 2000 Queue model and SIDRA 5.2 have a strong relationship in the case of volume to capacity (v/c) ratio less than 0.8. In the case of v/c ratio more than 0.8, the queue length that obtained from HCM model was higher than SIDRA. Moreover, the values of SIDRA and HCM 2000 are higher than those values achieved by other models [37].
SIDRA INTERSECTION 4 used to evaluate the performance of traffic flow in Petaling Jaya and Kuala Lumpur. The fuel consumption and average delay reduced while the travel speed increased [38].
Two models of back of queue, Highway Capacity Manual 2010 (HCM2010) and Red-Time Formula (RTF) were compared to the back of queue field. The 50th percentile of HCM queue length was statistically compared with field measured queue length. The results showed that the HCM model had significant differences from the observed data. Furthermore, the statistical 95th percentile of HCM and RTF queue lengths were compared with each other. In this case, the results obtained from HCM had more accurate results than the results obtained from RTF. At higher volume approaches, the RTF queue length tended to overestimate, while at lower volume approaches the queue length was underestimated on the minor streets [39].
The results of queue length obtained from field measurement were compared with the calculated queue length values using HCM method. The results of the comparison show that there is a good relationship between the observed and calculated queue length values in undersaturated conditions. While in oversaturated conditions, there is a big difference between the two models because of the appearance of the initial queue at the beginning of the analysis period [40].
A new approach for queue length at signalized intersections proposed using License Plate Recognition (LPR) data at Guiyang city in China. To determine blocked vehicles and vehicle stops, two types of critical points (FCP and SCP) were used in a particular link. The study solved the long Queue length at signalized intersections [41].
The SIDRA INTERSECTION 5 software was used to evaluate and analyse performance of four intersections and two roundabouts at Nicosia city. It found that the SIDRA INTERSECTION 5 software can be used to calculate the traffic flow characteristics in the city [42].
Three intersections and four roundabouts tried to evaluate traffic performance at Karbala city of Iraq. SYNCHRO and SIDRA INTERSECTION software were used to estimate the performance of both signalized intersections and roundabouts. Moreover, the best proposed model was determined as the result of evaluation [43].
Kalman Filter model used to estimate queue length based on real-time method by using shockwave theory. For the method used in their study a loop-detector was required per each link that should place at a correct location. The results of the study showed that the average error of queue length is 2.09 vehicles on a 313 m long link by using Vissim microscopic traffic simulation software [44].
The model proposed to predict the maximum back-of-queue at signalized intersection in Poland. The results obtained from the study indicate that the proposed model can be used for practical applications in estimating the maximum back-of-queue at signalized intersections located in built-up areas [45].
Partially connected vehicle (CV) was used to estimate cycle by cycle queue length. For this purpose, VISSIM and Python were used for generate the data. The study found that the evaluation and the signal timing design could be improved at signalized intersections by using the proposed method to estimate accurate queue length [46].
This study aims to evaluate the back of queue length of isolated signalized intersections which used HCS2010 and SIDRA Intersection 8 traffic software. The study also, aims to conduct a model of optimization for the back of queue length to decrease the value of storage length of vehicles following GA procedure.
2. MATERIALS AND METHODS
The first step was traffic data collection, the video recording camera type (HIK VISION (DS-2CD4A65F-IZ (H) (S))) was used to measure the volume, cycle time, green time, yellow time, and all red time for each arm of the intersections under study.
In the second step, manual measurement tape was used to measure the width of each approach and lane, and numbers of lanes were counted as well. Stop watch was used to measure the cycle time, green time, yellow, and all red time to double check that the results obtained from the video record count are precise.
At the third step, manual count was followed to measure the field back of the queue in this study by replaying the video recording many times. For this purpose, all vehicles in the queue were counted cycle by cycle for each lane in the analysis period (each 15 minutes).
In the fourth step of the methodology, two traffic signal analysis software systems were used to estimate queue length, the softwares were HCS2010 [47] and SIDRA Intersection 8 [48]. Then field observed the back of the queue compared with the results of the two software. Moreover HCS2010 and SIDRA Intersection 8 were used to develop an optimized model to reduce the storage queue length and delay.
The last step, SIDRA Intersection 8 can calculate the percentile values of queue length at signalized intersections. In this study, two percentile values 95th and 98th were chosen to estimate the probability of blockage of upstream lanes as well as the probability of the short lane overflow, which have relation to the back of queue percentile.
3. RESULTS AND DISCUSSION
3.1. Study Area, Data Collection, Software Representation
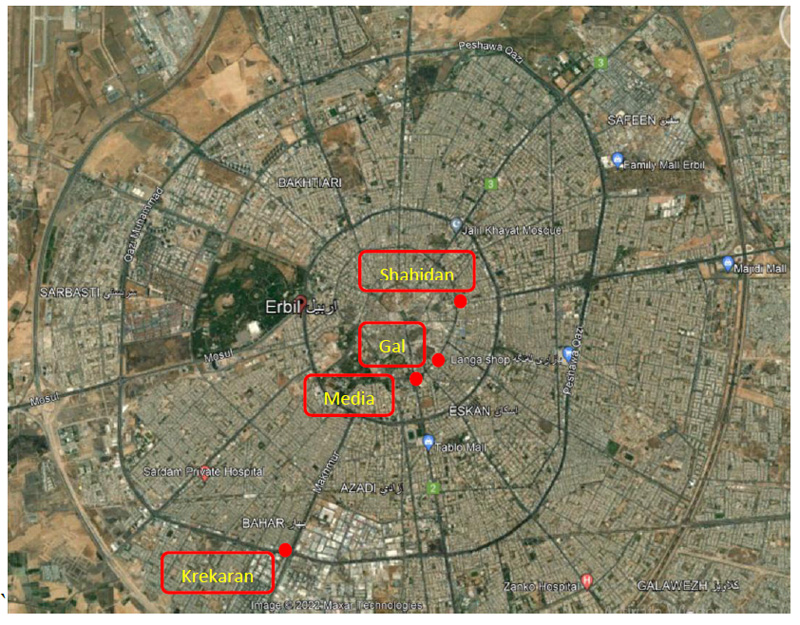
For this study, four signalized intersections were chosen in Erbil city, capital of Iraqi Kurdistan Region, to evaluate the back of queue length at peak hours as presented in Fig. (2). Three of these intersections are located on the inner ring road known as 30m road or (Barzani road). The other two intersections are located on the outer ring road known as 100m road (Qazi Muhammad Road). Data were collected approximately for a duration of 12 hours to find the morning and evening peak hours according to the traffic volume, as one hour was selected as the peak hour for three working days to collect detailed data.
| Int. | Int. Leg | Lane No. | Direction of Flow | Lane Width (m) | Approach Width | Grade % | |
|---|---|---|---|---|---|---|---|
| Shahidan | E | 1 | L+T | 4.15 | 8.30 | -0.5 | |
| 2 | R+T | 4.15 | |||||
| W | 1 | L+T | 3.47 | 6.94 | -0.6 | ||
| 2 | T | 3.47 | |||||
| 3 | R | 3.46 | 3.46 | ||||
| N | 1 | L+T | 4.00 | 12.00 | -0.9 | ||
| 2 | T | 4.00 | |||||
| 3 | R+T | 4.00 | |||||
| S | 1 | L+T | 4.00 | 12.00 | -0.9 | ||
| 2 | T | 4.00 | |||||
| 3 | R+T | 4.00 | |||||
Geometric data such as lane width, approach width, number of lanes, and approach grade were measured manually using a measuring tape and level instrument. Table 1 shows Shahidan Intersection geometric data as well as the flow direction as a sample.
For example, east approach of shahidan intersection was consist of two lanes that both of them were shared lane, each lane had 4.15m width, its approach with was 8.30 and its grade was -0.5.
Manual counting was used to measure the field back of queue length by replaying the recorded video at the study period cycle by cycle for each lane. Moreover data for traffic volume, cycle time, green time, yellow time, and all red time was obtained from the video recording technique. Geometric data such as approach width, lane width, and number of lanes was measured manually on site.
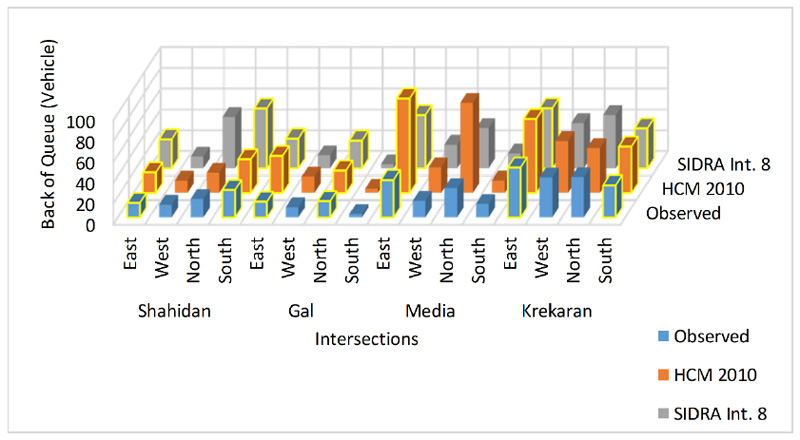
The obtained data were put into the software under study for the purpose of calculation, evaluation, and optimization. Field observed data output results obtained from HCS2010 and SIDRA Intersection 8 software, and back of queue length models for all intersections are presented in Table 2.
The hieghst average field, HCS2010 and Sidra Int. 8 back of the queue values are for Krekaran inersection, which are 48.0 veh., 62.6 veh. and 57.8 veh., respectively. While, the lowest average field and Sidra Int. 8 back of the queue values are for Gal intersection, which are 15.67 veh., and 28.6 veh., respectively.
The observed back of queue values were compared with the ones obtained from HCS2010 and SIDRA Intersection 8 back of queue values for all approaches of all intersections under study. It is clear in Fig. (3) that the field measured the back of queue values are approximately close to the values obtained from HCS2010 and SIDRA Intersection 8 programs in undersaturated conditions. But, the HCS2010 and SIDRA Intersection 8 values are higher than the observed back of queue values in oversaturated conditions. The south approach of Gal intersection and the east approach of Media intersection are examples for undersaturated and oversaturated conditions, respectively.
| Int. | Int. Leg | Observed | HCS 2010 | SIDRA | |||
|---|---|---|---|---|---|---|---|
| BOQ (veh.) | Int. BOQ (veh.) | BOQ (veh.) | Int. BOQ (veh.) | BOQ (veh.) | Int. BOQ (veh.) | ||
| Shahidan | E | 14.00 | 26.50 | 19.70 | 32.30 | 27.90 | 57.60 |
| W | 12.25 | 11.80 | 11.30 | ||||
| N | 17.75 | 19.30 | 49.30 | ||||
| S | 26.50 | 32.30 | 57.60 | ||||
| Gal | E | 15.17 | 15.67 | 35.60 | 35.60 | 28.60 | 28.60 |
| W | 9.83 | 15.60 | 12.60 | ||||
| N | 15.67 | 21.40 | 26.70 | ||||
| S | 3.17 | 4.10 | 3.90 | ||||
| Media | E | 36.00 | 36.00 | 90.90 | 54.00 | 51.20 | 51.20 |
| W | 16.00 | 24.50 | 22.70 | ||||
| N | 28.33 | 86.80 | 38.60 | ||||
| S | 13.00 | 11.90 | 14.30 | ||||
| Krekaran | E | 48.00 | 48.00 | 71.10 | 62.60 | 57.80 | 57.80 |
| W | 38.33 | 49.90 | 43.50 | ||||
| N | 38.67 | 43.2 | 51.20 | ||||
| S | 31.00 | 44.7 | 38.40 | ||||
| Intersection | Intersection Leg | Existing Green Time (sec) | HCS2010 Green Time (sec) |
SIDRA Int. 8 Green Time (sec) |
|---|---|---|---|---|
| Shahidan | E | 28 | 15.2 | 22 |
| W | 48 | 12.6 | 22 | |
| N | 52 | 21.9 | 36 | |
| S | 50 | 28.3 | 38 | |
| C | 210 | 110 | 150 | |
| Gal | E | 30 | 33.2 | 28 |
| W | 25 | 20.2 | 16 | |
| N | 30 | 27.3 | 30 | |
| S | 30 | 7.3 | 14 | |
| C | 147 | 120 | 120 | |
| Media | E | 55 | 48.3 | 36 |
| W | 38 | 18.1 | 19 | |
| N | 90 | 56.9 | 42 | |
| S | 50 | 14.7 | 21 | |
| C | 265 | 170 | 150 | |
| Krekaran | E | 78 | 47.5 | 32 |
| W | 75 | 38.4 | 32 | |
| N | 80 | 36.8 | 32 | |
| S | 40 | 25.3 | 32 | |
| C | 305 | 180 | 160 |
Existing green time, HCS2010 and SIDRA Intersection 8 green time after optimization process for the intersections under study are shown in Table 3. The existing green time for north approach of media intersection before optimization is 90 seconds while, the green time obtained from HCS2010 and SIDRA Intersection 8 software after optimization are 56.9 and 42.0 seconds, respectively.
Regression analysis method was used to determine the linear relationship between the field and the conventional model results of the back of queue. Linear relationship represents the best model between Observed and SIDRA Intersection 8 with adjusted R2 = 0.7238. It was found that the relationship between observed and SIDRA Intersection 8 back of queue values are strong, because the adjusted R2 values are relatively close to (1.00). While, the linear relationship between observed and values obtained from HCS2010 software back to queue values are weak. The scatter diagram and the curve fitting linear relationships between the field measured and two traffic analysis back of queue models are shown in Figs. (4 and 5).
Tables 4 and 5 summarizes the results of HCS2010 and SIDRA Intersection 8 optimization back of queue model, optimum cycle length, and percent reduction in the back of queue length. Application of the optimization process of the models used is based on GA causes an improvement in the performance of the intersections and a reduction in the back of the queue length with the optimum cycle time. The percent reduction in the back of the queue for HCS2010 and SIDRA Intersection 8, after application of the optimization process included in both software systems ranged from 28 to 43% with an average of 36%, and 24 to 39% with an average of 29%, respectively. It is clear that the percent average reduction of HCS2010 optimized model is higher than SIDRA Intersection 8. Furthermore, the value obtained from SIDRA Intersection 8 optimizing model has a lower intersection back of queue value compared to HCS2010 optimized model.
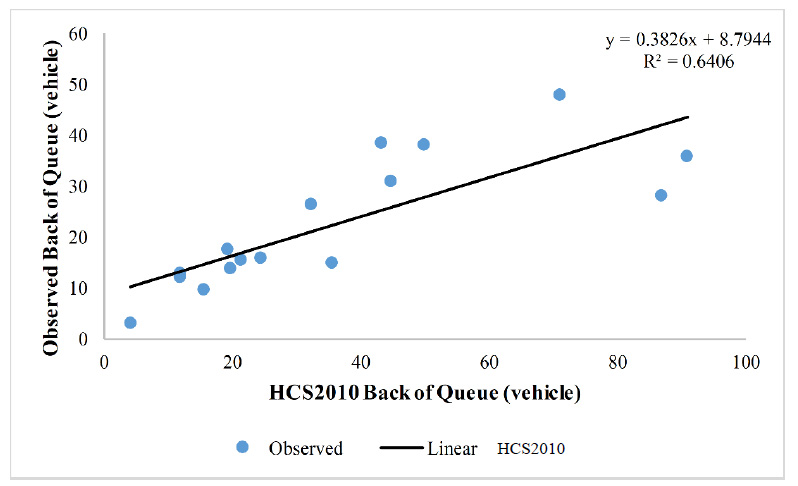
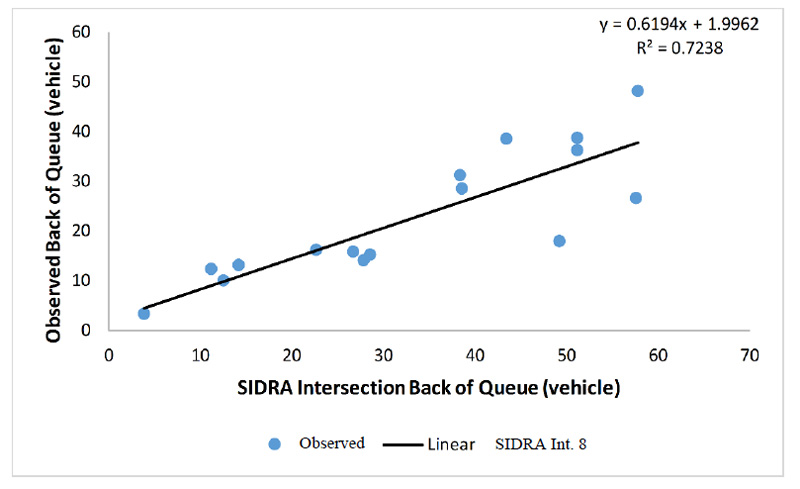
Table 4.
| Int. | Int. Leg | Hcs2010 | SIDRA | ||
|---|---|---|---|---|---|
| BOQ (veh.) | Int. BOQ (veh.) | BOQ (veh.) | Int. BOQ (veh.) | ||
| Shahidan | East | 11.2 | 18.5 | 19.9 | 43.9 |
| West | 10.6 | 9.6 | |||
| North | 13.3 | 40.2 | |||
| South | 18.5 | 43.9 | |||
| Gal | East | 21.6 | 21.6 | 20.6 | 20.6 |
| West | 13.2 | 12.4 | |||
| North | 15.8 | 17.9 | |||
| South | 5.2 | 3.7 | |||
| Media | East | 57.9 | 65.4 | 28.3 | 31.4 |
| West | 21.4 | 15.4 | |||
| North | 65.4 | 31.4 | |||
| South | 12.3 | 9.0 | |||
| Krekaran | East | 47.3 | 47.3 | 43.1 | 43.1 |
| West | 36.0 | 29.4 | |||
| North | 34.4 | 37.8 | |||
| South | 29.2 | 16.3 | |||
The 95th and 98th percentile Back of Queue length values for HCS2010 and SIDRA Intersection 8 are presented in Tables 6 and 7. The results of the 95th and 98th percentile values are the predicted maximum extended vehicles that queued from the stop line to the last queued vehicle. The higher value of the back of queue for the 98th percentile was for media intersection with a value of 155.0 vehicles for HCS2010 model. While the lower value of the back of queue for the 98th percentile was for Gal Intersection with a value of 48.2 vehicles for SIDRA Intersection 8 model for existing cycle time.
| Intersection | Shahidan | Gal | Media | Krekaran |
|---|---|---|---|---|
| HCS2010 | ||||
| Intersection BOQ | 18.5 | 21.6 | 65.4 | 47.3 |
| Reduction in BOQ (%) | 43 | 39 | 28 | 33 |
| SIDRA Int. 8 | ||||
| Intersection BOQ | 43.9 | 20.6 | 31.4 | 43.1 |
| Reduction in BOQ (%) | 24 | 28 | 39 | 25 |
| Intersection | Shahidan | Gal | Media | Krekaran |
|---|---|---|---|---|
| HCS2010 | ||||
| 95% Percentile BOQ | 51.8 | 57.0 | 145.0 | 114.0 |
| 98% Percentile BOQ | 55.0 | 60.5 | 155.0 | 121.0 |
| SIDRA Int. 8 | ||||
| 95% Percentile BOQ | 93.9 | 46.6 | 83.6 | 94.4 |
| 98% Percentile BOQ | 97.1 | 48.2 | 86.4 | 97.6 |
| Intersection | Shahidan | Gal | Media | Krekaran | |
|---|---|---|---|---|---|
| HCS2010 | |||||
| 95% Percentile BOQ | 30.0 | 34.8 | 105.0 | 75.8 | |
| 98% Percentile BOQ | 32.1 | 37.1 | 111.0 | 80.5 | |
| SIDRA Int. 8 | |||||
| 95% Percentile BOQ | 71.6 | 33.6 | 51.2 | 70.4 | |
| 98% Percentile BOQ | 74.0 | 34.7 | 53.0 | 72.8 | |
| Intersection | Shahidan | Gal | Media | Krekaran |
|---|---|---|---|---|
| HCS2010 | ||||
| Existing Cycle Time (sec) | 210 | 147 | 265 | 305 |
| Optimum Cycle Time (sec) | 110 | 120 | 170 | 180 |
| Intersection LOS before optimization | F | F | F | F |
| Intersection LOS after optimization | E | E | F | F |
| SIDRA Int. 8 | ||||
| Optimum Cycle Time (sec) | 150 | 120 | 150 | 160 |
| Intersection LOS after optimization | F | F | F | F |
| Intersection LOS after optimization | F | E | F | F |
The values of 95th and 98th percentile back of queue length are decreased with the optimization process by 33% for HCS2010 and 31% for SIDRA Intersection 8. This means that the risk of upstream lane blockage and overflow of short lanes were reduced by reducing the numbers of vehicles in the queue at intersection. Whereas the probability of blockage and overflow for upstream and short lanes were high before improving the intersection using the two software systems that mentioned above based on GA.
Cycle times before and after the optimization process and LOS for all intersections under study are illustrated in Table 8. It can be seen that the optimization process can cause a decrease in cycle time plan with reducing delay and queue length in both HCS2010 and SIDRA Intersection optimizing models.
Moreover, it is clear that in Table 8, the LOS of two Intersections Shahidan and Gal Intersection changed from LOS of F to E, which is used in HCS2010 optimizing model. The SIDRA Intersection 8 optimizing model improved only Gal Intersection LOS from F to, all other Intersections LOS F remaining the same LOS.
CONCLUSION
This study conducted a comparison between HCS2010, SIDRA Intersection 8 Back of Queue model and the field measured back of queue model at four isolated signalized intersections in Erbil city of Iraq. The results showed that the observed and the models used HCS2010, and SIDRA Intersection 8 Back of Queue models have a good relationship in case of undersaturated conditions. But, they have a poor relationship in oversaturated conditions. This is because the values obtained from both software HCS2010 and SIDRA Intersection 8 of the Back of the Queue were higher than the field measured Back of Queue. From the results of regression analysis, it can be concluded that the SIDRA Intersection 8 Back of Queue model has a better relationship than the observed Back of Queue with adjusted R2 = 0.8465.
Moreover, in this study, the optimum cycle time was obtained following the GA method available in the models used to minimize the Back of Queue length at signalized intersections. The objective of using GA to find the optimum cycle time is to reduce the Back of Queue length at the signalized intersections under study based on Highway Capacity Manual (TRB 2010) procedure for Queue length calculations.
It can be concluded also that an improvement was noticed in the performance of the intersections after obtaining the optimum cycle time for the traffic signals at the intersections under study. The values of cycle time reduced by 36% for HCS2010 and 39% for SIDRA Intersection 8 Back of Queue model after the application of the optimization process included in the software models, which led to reduced queue length, delay and improvement in LOS.
RECOMMENDATIONS
It is recommended for the improvement in the performance of the intersections in Erbil city, that the responsible authorities should revise the cycle timing of all intersections controlled by traffic signals. This can be done by using detectors and collection of updated data then using software for design.
In addition to this, the intersections should be connected to each other using linked signals and area traffic network. Also, for the better performance of the intersections together, the application of Intelligent Transportation System, ITS after creating of suitable infrastructure for this purpose is vital.
LIST OF ABBREVIATIONS
| ARRB | = Aid Australian Road Research Board |
| GA | = Genetic Algorithm |
| LWR | = Lighthill–Whitham–Richards |
| HCM | = Highway Capacity Manual |
| SIDRA | = Signalized and Un-signalized Intersection Design and Research Aid |
| CV | = Connected Vehicle |
CONSENT FOR PUBLICATION
Not applicable.
AVAILABILITY OF DATA AND MATERIALS
Not applicable.
FUNDING
None.
CONFLICT OF INTEREST
The authors declare no conflicts of interest, financial or otherwise.
ACKNOWLEDGEMENTS
The authors are grateful to Scientific Research Center at Erbil Polytechnic University (EPU) for providing their support.

