All published articles of this journal are available on ScienceDirect.

Willingness to Pay for Autonomous Vehicles before and after Crashes: A Demographic Analysis for US Residents
Abstract
Background:
It is anticipated that autonomous vehicles (AVs) can achieve many benefits, such as improving traffic safety and increasing mobility of people with limited modes of transportation. However, the public attitude remains the controlling factor determining the degree to which AVs can achieve these benefits. While it is expected that the public acceptance of AVs would increase over time due to the increase in the level of awareness and knowledge about this new technology, previous surveys show that people become more pessimistic towards AVs over time. While this pattern has never been investigated, some studies link this negative shift in the attitude to AVs accidents.
Objective:
This study focuses exclusively on understanding the impact of AV crashes on the willingness to pay extra to buy an AV for people from the US. In addition, the analysis focuses on evaluating changes in the willingness to pay for AVs before and after crashes for people with different demographics in order to understand how the different groups react to these accidents.
Methods:
A questionnaire survey was designed and conducted between February and September of 2022 and a total of 2,144 responses were received and analyzed to understand the impact of these crashes on respondents with different demographic properties (age, gender, household income, educational level, prior knowledge about AVs, and prior knowledge about AV crashes). In addition, hypothesis testing was utilized in order to evaluate whether the changes in the willingness to pay extra for AVs after introducing the accidents are significantly different from the willingness to pay for AVs before introducing the accidents.
Results:
The results show that the willingness to pay extra to buy an AV decreased by 29% after the crashes were introduced to the respondents, while the decline in the willingness to pay extras varies across the different demographic groups investigated.
Conclusion:
The results show the significant negative impact of AV crashes on the public attitude as the average willingness to pay extra for AVs decreased from 8,412 USD before the crashes to 6,007 USD after the crashes. In addition, the results show that the decrease in the willingness to pay for AVs is statistically significant for different demographic groups.
1. INTRODUCTION
In general, there are six levels of automation, starting from level 0 to level 5. Level 0 refers to the case of no automation at
all or, in other words, human-driven vehicles where the human driver completes all the driving tasks. Then, the number of automated features increases with the increase in the level of automation. Levels 1 and 2 refer to the automation of specific tasks, such as the lane-keeping system, while level 3 refers to partial automation with the necessity of having the driver behind the steering wheel all the time to take control if needed. In this case, the driver must pay attention to the surrounding conditions and evaluate them to ensure the car is traveling without causing any risks. Then, level 4 of automation refers to highly automated vehicles, and in this case, the vehicle has the ability to perform all the driving tasks while the driver has the ability to take control of the vehicle whenever desired. Finally, level 5 refers to fully autonomous vehicles (AVs) or full automation, and in this level, the vehicle has the ability to perform all tasks, and the human driver might not have the option to take manual control of the vehicle [1-3].
It is anticipated that AVs will change the shape of cities because they will change how people travel, work, and commute [1]. For example, the adoption of AVs will enable users to spend their travel time engaged in non-driving tasks, allowing them to engage in productive tasks (such as working, reading, or writing) [2,3]. The elimination of the human driver from the driving tasks will reduce driving anxiety as it eliminates the time spent searching for a parking space [3] and increase the mobility of people with limited modes of transportation, such as the elder and people with medical issues [4]. In addition, the elimination of human error from the driving process is anticipated to have a major impact on traffic safety, as human error contributes to 90% of traffic accidents [1]. Thus, one of the main benefits of AVs is their ability to improve traffic safety which saves a lot of resources such as healthcare resources and repair costs [5]. On the other hand, AVs possess new risks that do not exist with human-driven vehicles. For example, it is anticipated that AVs will reduce the pavement life cycle as a result of the decrease in the wheel wander that will occur because of the lane-keeping system that will make the vehicles to follow the same paths and thus increase the stresses and loads the pavement have to carry [6]. In addition, it is anticipated that AVs will have the potential to reduce the gaps (lateral and longitudinal) between the vehicles while travelling because of the illumination of the human factor. Thus, it is expected that the capacity of the roads will increase. While this impact is positive, it also poses new risks. One of the main issues associated with the increase in the capacities is the risk exposed to bridges that are designed based on specific guidelines and design methods that do not consider AVs (autonomous truck platoons) and the reduction in the gaps. Thus, this increase in capacity will add new risks to the safety of bridges existing on our roads [5].
While it is anticipated that AVs can achieve multiple benefits, the public remains skeptical about this emerging technology and leaves their lives in machines' hands [1]. In general, there is a large number of concerns about different aspects of AVs, such as the vehicle performance in different scenarios and conditions, the decisions of the vehicles in case of avoidable accidents (the moral dilemma), privacy issues, hacking issues and system security, and the unclear legal situation and liability issue in case of accidents [6-11]. In general, previous surveys show that the public attitude towards AVs becomes more negative over time. For example, the American Automobile Association (AAA) conducted a questionnaire survey in 2017 in order to understand the public attitude towards AVs in the US. The results of the survey showed that 63% of US residents were afraid of AVs [12]. On the other hand, the AAA replicated the same survey in 2019 and the results show that while the public in the US became more familiar with AV technology in 2019 than in 2017, the level of fear of AVs was higher in 2019, moving from 63% in 2017 to 71% in 2019 [13]. The same patterns can be noticed in multiple surveys over time [11-14]. While this pattern has never been investigated before to reveal the main factors that lead to this decline, some studies linked this decline with the accidents involving AVs [1, 11]. In general, earlier analyses of public opinion towards AVs have focused on determining how demographic characteristics affect public opinion [15-20]; however, the demographic properties do not significantly change in a specific country over time, so the change in the public attitude cannot be translated using the demographic characteristics. Therefore, additional research on the effect of AV accident-related changes on public opinion is required to comprehend these changes fully.
This study aims to comprehend how AV accidents affect public perception of AVs. The willingness the pay extra for AVs is the most important factor that reflects how the public perceives AVs [1]. In general, different surveys from all over the world, show that the public is unwilling to pay extra for AVs [11, 21]. This reluctance from the public indicates that most of the public perceives the risks of AVs with higher weight than the benefits [1]. This study focuses on understanding the impact of accidents involving AVs on the willingness to pay for AVs for respondents from the US. In order to comprehend how the various demographic groups react to these incidents, the analysis is also carried out for respondents with different demographic characteristics (age, gender, educational level, income, background information about AVs, and prior knowledge about AV crashes). This paper consists of four main sections. The first section provides some background information about AVs and the public acceptance of the technology. The second section provides a detailed discussion of the research methodology and the questionnaire survey conducted. Then, the third section provides a detailed discussion about the impact of accidents of AVs on the public attitude. The analysis conducted in this section is categorized and separated based on demographic properties in order to understand how the different groups react to these accidents. Finally, the fourth section is the conclusion section which provides the key takeaways of this study.
2. METHODOLOGY
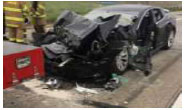
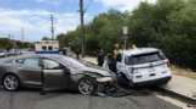
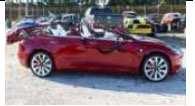
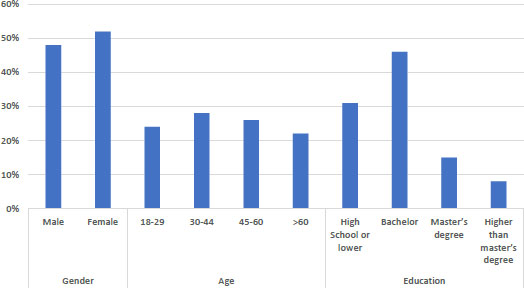
The purpose of this study is to assess how AV accidents can affect the public perceptions of AVs. The public attitude is evaluated through the public willingness to pay extra to buy an AV. Thus, in other words, this study focuses on evaluating the impact of AVs’ crashes on the willingness to pay extra to buy an AV. Thus, a questionnaire survey was designed and conducted in order to collect the responses of residents in the US. The survey was designed to quantify the impact of accidents involving AVs on the public attitude in terms of the willingness to pay extra to buy an AV. Before publishing the survey to the public, a pilot survey was conducted to pre-test the questions to ensure that the questionnaire is fair, understandable, and easy to respond to. During the pilot survey, the survey was sent to three experts who conducted surveys related to AVs and their opinions about the survey were collected. The experts stated that they found the survey fair, and easy to understand and respond to. In addition to the pilot survey with the expert, an additional stage was conducted in order to gather the public opinion about the survey. In this stage, the survey was sent to thirty respondents who live in the US and they were asked to give their opinion about the survey. In general, there was a high level of satisfaction with the survey and its questions, as all the respondents highlighted that they had no problem in the process of conducting, understanding, or responding to the survey. At this point, the survey was sent to the public through the SurveyMonkey platform in order to collect responses. Four primary sections made up the survey. In the first section, background information regarding the research and AVs was given to the responders. The second section aims to gather demographic data about the respondents, including age, gender, educational achievement, household income, and prior awareness of AVs. The third portion then concentrates on gathering data about respondents' willingness to pay more for an AV. In addition, this section ended with a question about the respondents’ prior knowledge about any accident that involved an AV. Finally, section four focuses on estimating the respondents’ willingness to pay extra to buy an AV after accidents. This segment started out by introducing the respondent to seven notable AV-related malfunctions. These incidents ranged in severity from collisions with only property damage to ones that resulted in fatalities. They serve as examples of various AV faults (such as steering problems, speed control, or issues related to the vehicle's vision). These accidents were presented with some visual illustrations of the accident and text that describes the accident and explains the situation as summarized in Table 1. The survey was published through SurveyMonkey between February and September of 2022. There were 2,144 full survey replies submitted by respondents from all around the US. Fig. (1) summarizes the demographic properties of the respondents who complete the survey. Comparing the demographics with the 2022 United States Census Bureau report [22], which shows the demographic properties of the US residents, demonstrates that the survey sample accurately reflects the overall population.
| Visual Illustration | Date of the Crash | Type of the Crash | Location | AV Brand | Description of the Crash |
|---|---|---|---|---|---|
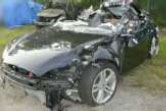 |
2016, July | Fatal accident | Florida | Tesla | This was the first fatal accident that involved an AV. The car was in the AV autopilot mode while the vehicle’s sensor failed to visualize a truck that was crossing ahead. The vehicle collided with the truck resulting in a fatal crash. This accident was widely covered in the media at the time of the crash. |
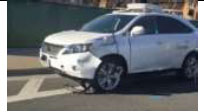 |
2016, February | Property damage only | California | At the time of the crash, Google’s AVs managed to travel for 2.25 2.25 million Km safely. This accident occurred at an intersection as the vehicle collided in a bus highlighting the imperfections of this emerging technology. | |
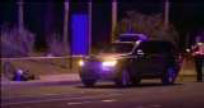 |
2018, February | Pedestrian Fatal accident | Arizona | Volvo | This was the first pedestrian fatal accident involving an AV. The AV was a Volvo vehicle that was operated by Uber. The vehicle crashed into a pedestrian who was crossing the street with a bicycle outside the crosswalk. |
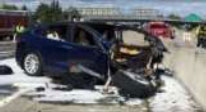 |
2018, March | Fatal accident | California | Tesla | The vehicle was in the autopilot mode when it decided to speed up and steer to hit the concrete barrier resulting in a fatal crash. The National Transportation Safety Board (NTSB) report showed that the vehicle was not following the speed limits or the path of the lane four seconds before the cash. |
 |
2018, May | Minor injury | Utah | Tesla | The autopilot mode was taking control of the vehicle while the vehicle speeded up and steered to collide in a fire truck. The driver was looking at her phone thinking that the vehicle’s system will be able to take the appropriate actions to keep everyone safe. |
 |
2018, May | Minor injury | California | Tesla | The autopilot mode was on when the vehicle decided to speed up and steer to hit a parked police car resulting in minor injuries. |
 |
2019, March | Fatal accident | Florida | Tesla | The autopilot mode was on when the vehicle collided into a truck resulting in the shearing of the vehicle’s roof which led to a fatal crash. The autopilot mode was turned on just ten seconds before the crash and the driver was not paying attention to the road. |
3. RESULTS AND DISCUSSION
This study focuses on understanding the impact of accidents involving AVs on the public attitude in terms of the willingness to pay extra to buy an AV. The analysis was conducted on the entire sample first. Secondly, in order to assess how these accidents affect various groups with various demographics, a thorough study of respondents with diverse demographic features was carried out. In addition, hypothesis testing was conducted to test the significance level of the change in the willingness to pay extra to get an AV after the accidents. For hypothesis testing, the null hypothesis and alternative hypotheses are summarized in equations 1 and 2. In this case, we test whether there is a significant difference in the two means of willingness to pay before and after the crashes are equal. The null hypothesis shown in equation 1 indicates that the willingness to pay extra for AVs does not show a statically significant difference before and after introducing the accidents, indicating that AV accidents do not have a statistically significant impact on the public attitude. On the other hand, the alternative hypothesis shown in equation 2 means that the changes in the willingness to pay more for AVs after the accidents are statically significant from the willingness to pay more for AVs before the accidents. Thus, the t-test was adopted and performed to validate and compare these two hypotheses. In addition, a 95% confidence level was tested to check whether there is a significant difference between the two means. In this case, if the resulting p-value was higher than 0.05, we cannot reject the null hypothesis indicating that the two means are equal or, in other words, there is no statistically significant difference between the two means. On the other side, if the estimated p-value is lower than 0.05, the null hypothesis can be rejected, indicating that there is a statistically significant difference between the two means or, in other words, the two means are not equal.


Firstly, analyzing the overall responses received shows that the average willingness to pay extra to get an AV dropped from 8,412 USD before the crashes to 6,007 USD after the crashes, with a 28.6% reduction in the willingness to pay more for AVs. Table 2 summarizes and compares the average willingness to pay extra to buy an AV showing the resulting p-value to test the level of significance of the change in the willingness to pay extra for AVs. The resulting p-value is 0.00037, which is lower than 0.05, indicating that there is a statistically significant difference in the average willingness to pay extra for AVs before and after the accidents. These results show how accidents involving AVs can negatively affect public attitudes and result in a 28.6% reduction in the willingness to pay extra for AVs. The next subsection will show how the willingness to pay for AVs is affected after accidents for respondents with different demographic properties.
| - | Average Willingness to Pay Extra (USD) | P-value | % Change |
|---|---|---|---|
| Before | 8412 | 0.000366 | -28.5901 |
| After | 6007 |
3.1. The effect of AV crashes on the Willingness to Pay for Male and Female Respondents
In general, previous surveys show that females are more concerned about AVs than males and the level of fear of females is higher than males [23-28]. This subsection mainly focuses on understanding the impact of AV crashes on male and female respondents. Fig. (2) shows a comparison between the average levels of willingness to pay extra to buy an AV for male and female respondents before and after the crashes. For both male and female respondents, there is 25-29% decrease in the willingness to pay extra for AVs as the willingness to pay extra dropped from 9,470 USD to 6,736 USD for male respondents and from 6,964 USD to 5,173 USD for female respondents. Although male and female respondents' willingness to pay for AVs changed before and after accidents with a similar pattern, these results also highlight the differences between male and female respondents' attitudestoward AVs. Results indicate that male respondents were more upbeat and prepared to pay more for AVs before and after the incidents. The average willingness to pay more for female respondents before the crashes is 6,964 USD which is similar to the average willingness to pay for male respondents after the crashes (6,736 USD). This similarity shows how female respondents are less willing to pay extra to get an AV compared to male respondents. Finally, for the hypothesis testing, The findings demonstrate that both male and female respondents' average willingness to spend more to purchase an AV differs statistically significantly, and the p-values of 0.0026 and 0.0284 are less than 0.05, allowing us to reject the null hypothesis. As a result, it can be said that there is a statistically significant difference between male and female respondents in terms of their readiness to spend moreon an AV.
3.2. The effect of AV Crashes on the Willingness to Pay of Respondents of Different Ages
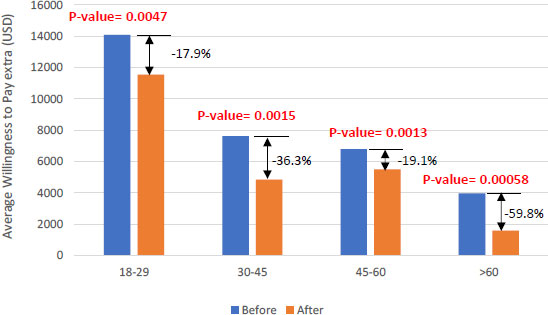
Previous studies in the literature highlighted that the age of the respondents is a main factor that affects their attitude towards AV. According to prior research, younger respondents are often more positive about AVS than older ones [1, 29-31]. This section focuses on determining how AV collisions affect respondents' willingness to participate with various ages. Fig. (3) shows the average willingness to pay extra to buy an AV for the different groups before and after the crashes. Comparing the willingness before and after shows that the average willingness to pay extra for AVs decreases after the crashes for all the groups as it dropped from 14,087 USD to 11,559 for respondents whose ages are between 18 and 29 years (17.9% drop), from 7,627 USD to 4,858 USD (36.3% drop) for respondents with an age of 30-45 years, from 6,801 USD to 5,501 USD (19.1% drop) for respondents with ages within 45-60 years, and from 3,964 USD to 1,592 USD (59.8% drop) for respondents older than 60 years. While these results show how AV crashes affect the willingness to pay for respondents with different age groups, they also shed light on the difference in the attitude between the respondents in the different age groups. The results show that younger respondents are more willing to pay extra to buy an AV than older respondents. Younger respondents (18-29 years) are willing to pay twice more as older respondents to buy an AV (before and after the accidents). In addition, younger respondents are the least affected after the accidents as this is the group with the least drop (17.9%) in their level of willingness to pay for AVs compared to the other groups. Moreover, the average willingness to pay extra to buy an AV for younger respondents after the accidents (11,559) is more than 1.5, the willingness of the older groups to pay extra to buy an AV before the crashes showing the difference in the attitude between the younger and the older groups. Finally, for the hypothesis testing, the results show that the resulting p-values for the different groups are lower than 0.05, indicating that the null hypothesis should be rejected. In their words, these results show a statistically significant difference in the mean willingness to pay extra to buy an AV before and after the crashes for the different groups. Thus, the results show that these crashes significantly impact the average willingness to buy extra to buy an AV.

3.3. The Effect of AV Crashes on the Willingness to Pay of People with Various Annual Incomes
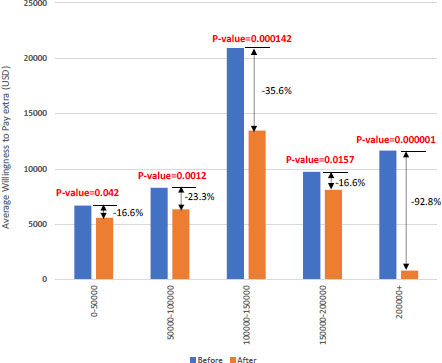
While earlier research examined the effects of demogra phic characteristics on public perceptions of AVs, the major focus of these studies is on examining the effects of age and gender. Thus, the impact of the household income has been rarely discussed in the literature. The study by Lee et al. [32] analyzed the relationship between household income and public acceptance of AVs. The results of this study show that there is a parabolic relation between the public attitude and household income, where respondents with intermediate household incomes had the highest level of acceptance of AVs while respondents with the highest and lowest levels of household incomes had lower and similar levels of acceptance of AVs. This subsection focuses on examining the effects of AV accidents on respondents' willingness to spend more money to get an AV, considering their family incomes. Fig. (4) displays the typical respondents' willingness to pay more before and after the incidents, depending on the incomes of their families. The results show that the willingness to pay extra to buy an AV drops for all respondents within the different income levels but with different magnitudes. Respondents with a household income of 0 to 50K USD showed a 16.6% reduction in their willingness to pay for AVs after the accident moving from an average willingness of 6,703 USD before to 5,583 USD after the crashes, while the other groups show higher drops in their willingness to pay. In general, respondents with an intermediate household income of 100K to 150K USD have the highest level of willingness to pay extra to buy an AV before and after the accidents compared to the other groups the average willingness to pay extra for an AV for respondents with a household income of 100K to 150K USD after the crashes (=13,464 USD) is higher than average willingness to pay extra to buy an AV for respondents from the remaining groups before the accidents. According to these findings, respondents with middle-class family incomes were the most eager to pay for AVs both before and after the incidents. Finally, the hypothesis testing shows that the resulting p-values for the different groups are lower than 0.05, indicating a statistically significant difference between the average willingness to pay extra for AVs before and after the crashes for the different household income groups.
3.4. The Effect of AV Crashes on the Willingness to Pay of Eespondents with Different Educational Levels
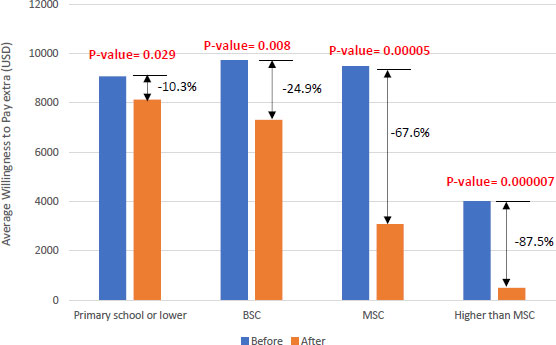
Similar to household income, previous studies have rarely discussed the relationship between educational level and willingness to pay for AVs. Previous studies highlighted that people with higher educational levels are more interested in AVs [33-35]. In this subsection, the analysis will focus on understanding the impact of accidents involving AVs on the public attitude in terms of the willingness to pay extra to buy an AV for respondents with different educational levels. Fig. (5) compares the average willingness to pay more for an AV before and after the accidents for respondents with various levels of education. The results show that the average willingness to pay decreases after the accidents for the different groups but with different magnitudes. This decrease in the willingness to pay increases with the increase in educational levels attained as the average willingness to pay for AVs decreased from 9,073 to 8,134 USD (10.3% decrease) for respondents who attained a primary school or lower, from 9,731 to 7,309 USD (24.9% decrease) for respondents with a bachelor degree, from 9,486 to 3,076 USD (67.6% decrease) for respondents with a master degree, and from 4,012 to 500 USD (87.5% decrease) for respondents with a degree higher than a master’s degree. Before introducing the crashes to the respondents, the results show that the average willingness to pay for AVs increases with the increase in the educational levels attained, except for the respondents with an educational level higher than a master’s degree, which is consistent with the results of previous studies that investigated the relationship between the educational level and the public acceptance of AVs [33-35]. On the other hand, there is an inverse relationship between the educational level attained and the willingness to pay extra to buy an AV as the average willingness to pay for AVs decreases with the increase in the educational level attained. These results show that respondents with higher educational levels are the most willing to pay extra for AVs before crashes. As opposed to this, the findings indicate that respondents with the lowest educational levels are the most eager to pay more for AVs, and that this readiness to pay more for AVs declines as educational level increases. Ultimately, the results of the t-testing indicate that the null hypothesis may be rejected because the calculated p-values are less than 0.05. In other words, it is possible to claim that there is a statistically significant difference between the two groups' willingness to pay more for an AV before and after the incidents.
3.5. The Effect of AV Crashes on the Willingness to Pay of Respondents with Different Levels Of Prior Knowledge about AVs
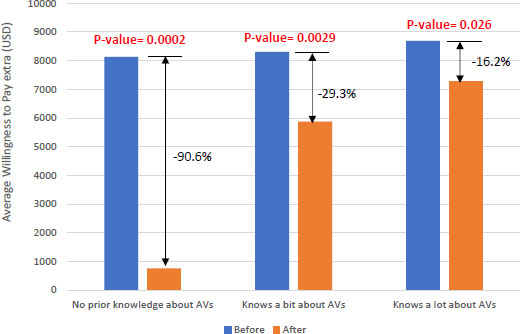
Earlier research looked into the connection between public opinion and prior awareness of AVs in their features. These studies demonstrate that people who are familiar with AVs have the highest levels of acceptance for this new technology and are the most positive about AVs [36-39]. As a result, the study in this part concentrates on figuring out how prior awareness of AVs affects consumers' willingness to spend more for an AV. The level of previous knowledge regarding AVs in this study includes two variables: prior knowledge of AVs and prior awareness of AV-related accidents (which has never been investigated in the literature). While the next subsection will concentrate on understanding the impact of accidents involving AVs on respondents with prior knowledge about accidents involving AVs, this subsection primarily focuses on understanding the impact of accidents involving AVs on respondents' willingness to pay more to buy an AV. Fig. (6) highlights respondents' average willingness to pay more for an AV before and after the crashes for respondents with various levels of prior knowledge about AVs. The results show that the willingness to pay extra to buy an AV decreases across the different levels of prior knowledge about AVs but with different magnitudes as it dropped from 8,137 to 762 USD (90.6% decrease) for respondents with no prior knowledge about AVs, dropped from 8,313 to 5,876 USD (29.3% decrease) for responded who know a bit about AVs, and dropped from 8,692 to 7,283 USD (16.2% decrease) for respondents who know a lot about AVs. These results show that the willingness to pay extra to buy an AV increase with the increase of the level of prior knowledge about AVs before and after introducing the accidents. However, this increase is minor before the accidents and major after the accidents as the willingness to pay extra to buy an AV after introducing the accidents is 762 USD, 5,876 USD, and 7,283 USD for respondents who have no prior knowledge, know a bit about AVs, and know a lot about AVs. These results show how prior knowledge is important in order to improve the willingness to pay extra for AVs especially after accidents as respondents with higher levels of knowledge were willing to pay more to get AVs both before and after introducing these crashes. Finally, for the hypothesis testing, the results show that the resulting p-values comparing the means before and after the accidents are all lower than 0.05, indicating that there is a significant difference in the average willingness to pay extra for AVs across the different levels of prior knowledge about AVs.
3.6. The Effect of AV Crashes on the Willingness to Pay of Respondents with Different Levels of Prior Knowledge about Crashes that Involved AVs
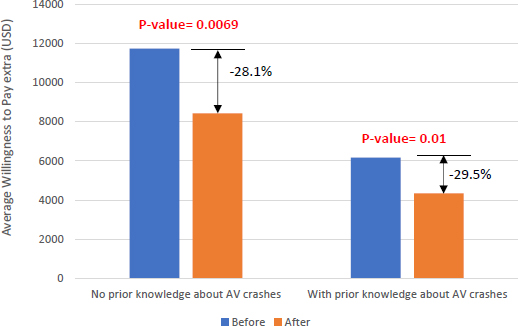
As mentioned in the previous subsection, prior studies focus on understanding the relationship between the level of prior knowledge about AVs and the public attitude. Nevertheless, none of these research examined the correlation between the public's perception of AV crashes and their level of prior knowledge. As a result, in this study, prior knowledge is identified in terms of two factors. The first component is the degree of prior awareness of AVs, which was covered in the previous part. The second factor, which will be covered in this subsection, is the level of prior knowledge concerning accidents involving AVs. Thus, the main scope of this subsection is to understand and quantify the impact of AV crashes on the willingness to pay extra to buy an AV for respondents with different levels of prior knowledge about AV crashes. Fig. (7) depicts respondents' average willingness to pay more for an AV before and after the crashes for those with varying degrees of prior awareness of these accidents. The findings indicate that after including the accidents, respondents' willingness to pay more for AVs declines for both categories, falling from 11,724 to 8,428 USD (a 28.1% drop) for those who had no prior awareness of these accidents and from 6,166 to 4,347 USD (a 29.5% loss) for those who had. In addition, respondents with no prior knowledge about AV crashes are willing to pay more to buy an AV before and after the crashes than respondents with no prior knowledge about these crashes. Respondents with no prior knowledge about AV crashes are willing to pay 8,428 USD extra after the crashes which are higher than the average willingness to pay extra for respondents with prior knowledge about these accidents before introducing the accidents (6,166 USD). Consequently, it can be inferred that respondents with prior information about AV crashes have a more unfavorable attitude about AVs than respondents without prior knowledge, which illustrates the significant influence of the bad news regarding AVs and their accidents on the general public's perception. Lastly, the hypothesis testing findings demonstrate a statistically significant difference between respondents with and without prior knowledge of AV crashes in terms of the average willingness to pay more for an AV before and after crashes.
CONCLUSION
This study focuses on understanding the impact of AV crashes on the public attitude towards AVs in terms of the willingness to pay extra to buy an AV. In order to evaluate the public’s readiness to pay more for an AV before and after accidents, a questionnaire survey was carried out. The study aimed to question respondents about their willingness to pay more for AVs. After introducing the respondents to seven accidents involving AVs of varying severity, the respondents were once again asked about their readiness to pay more for an AV. The data were analyzed to understand how these accidents affect the willingness to pay extra. The survey was published through SurveyMonkey platform between February and September of 2022. A total of 2,144 were collected from respondents from the US. The data were examined to see how these collisions affected respondents with various demographic characteristics (gender, age, household income, educational level, prior knowledge about AVs, and prior knowledge about AV crashes). The results show that AV accidents decrease the public willingness to pay extra for AVs for all the respondents across the different demographic groups investigated and the main results of this study can be summarized as follows:
- For the overall responses, the results show that AV crashes resulted in a 29% decrease in the willingness to pay more to buy an AV.
- Male respondents are willing to pay more to buy an AV before and after crashes the average willingness to pay extra for an AV for male respondents after crashes was similar to the average willingness to pay extra for an AV for female respondents before the crashes. However, the percentage drop in the willingness to pay extra after crashes were similar for the two groups (29% drop for male respondents and 25.7% drop for female respondents)
- Younger respondents are willing to pay much more extra to buy an AV compared to older respondents younger respondents highlighted that they are willing to pay 2 to 3 times more than older respondents to buy an AV before and after the accidents.
- For the household income, the results show that respondents with intermediate household incomes are the most willing to pay extra to buy an AV before and after the accidents. Nevertheless, the readiness to pay more for AVs was lowest among respondents with the highest and lowest family incomes.
- For the educational levels attained, the results show that while the willingness to pay extra for AVs increases with the increase in the average willingness to pay extra for AVs before the crashes, the willingness to pay extra to buy an AV shows an inverse relationship with the educational levels attained after the accidents as the willingness to pay extra for AVs after the accidents decreases with the increase in the educational levels attained.
- A person's tendency to pay more for AVs after crashes are significantly influenced by their prior awareness of AV technology. In general, as awareness of AVs increases, so does consumers' willingness to spend more for an AV. The findings reveal that respondents' willingness to pay more to purchase AVs before crashes is similar to those with and without previous awareness of the technology. However, after crashes, this change becomes major as the willingness to pay extra for AVs increases from 762, to 5,876, and to 7,283 USD for respondents with no prior knowledge about AVs, respondents who know a bit about AVs, and respondents who know a lot about AVs. These results show how prior knowledge about this technology is critical in order to improve the willingness to pay extra for AVs, especially after crashes.
- Finally, respondents who were unaware of AV crashes before and after the collisions were reported to be more likely to pay more for an AV. Respondents with no prior knowledge about these crashes are willing to pay 8,428 USD extra after the crashes which is higher than the average willingness to pay extra for respondents with prior knowledge about these accidents before introducing the accidents (6,166 USD). As a result, it can be inferred that respondents with prior knowledge of AV collisions had a more unfavourable attitude about AVs than respondents without prior information, which illustrates the significant influence of the bad press about AVs and their accidents on the general public's perception.
LIST OF ABBREVIATIONS
| AV | = Autonomous Vehicle |
| AAA | = American Automobile Association |
CONSENT FOR PUBLICATION
Informed consent was obtained from all subjects involved in the study.
AVAILABILITY OF DATA AND MATERIALS
The data presented in this study are available upon request from the corresponding author [K.O].
FUNDING
None.
CONFLICT OF INTEREST
The author declares no conflict of interest, financial or otherwise.
ACKNOWLEDGEMENTS
Declared none.

