All published articles of this journal are available on ScienceDirect.

The Impact of COVID-19 Pandemic on Public Transport: A Mobility Survey in Naples (South of Italy)
Abstract
Introduction:
The COVID-19 outbreak has not only had a fatal impact on people's lives, but it has also threatened the entire world of transportation. The number of trips, the mobility habits and the users’ mode choices from the beginning of the pandemic has changed significantly over the last year.
Objective:
This manuscript analyzed the effects of the COVID-19 pandemic on the users’ mobility choices following the pandemic phases during “new normality” was analysed. The objective of this research is twofold: i) to estimate and evaluate the changes in user's mode choices and environmental impact; ii) to identify mobility policies aimed at fostering the use of local Public Transport (PT).
Methods:
A Stated Preference survey was carried out during the COVID-19 pandemic in the city of Naples (South of Italy): i) to assess users’ mobility habits before the COVID-19 pandemic; ii) to evaluate users’ choice of Public Transport after the COVID-19 pandemic period; iii) to identify the attributes related to users’ reluctance (e.g., fear of contagion, service uncertainty) to continue using public transport and the main characteristics that Public Transport should have to be perceived as a safe transport alternative.
Results:
The results show that 56% of users would be willing to wait up to 20 minutes longer for the bus and train to ensure social distancing, especially on reliable info mobility.
Conclusion:
Moreover, 6% of the users, who previously travelled with local PT, would shift to private transport. This means that in the province of Naples, there would be more than 54 million trips by private car with the subsequent effects on congestion and environmental pollution in one month.
1. INTRODUCTION
Coronavirus disease 19 (COVID-19) originated in Wuhan city of China, in early December 2019 and has rapidly widespread with confirmed cases in almost every country worldwide and has become a new global public health crisis. In March 2020, the World Health Organization (WHO) formally declared the COVID-19 outbreak a global pandemic. In early 2023, a total of 660 million cases and 6,7 million deaths were declared worldwide [1]. In the first months of the pandemic, governments aimed to reach two objectives. Firstly, limit the number of deaths; secondly, guarantee the financial survival of households and businesses, and then start a new phase of economic growth to avoid an economic recession. Italy was the first country in Europe to experience the pandemic and the first country in Europe to face a health emergency. In the first months of the pandemic, Italy applied strict policies to limit the spreading of the virus (lockdown), stopping many economic activities, and the number of trips in cities and between cities reached minimum values (see section 2.1). Once the first wave seemed to be concluded, it was necessary to reopen many business activities; however, the two objectives are closely linked: it is fundamental to avoid choosing between physical and economic well-being. Despite the administration of the vaccine, the spread of variants has made some restrictions inevitable. Indeed, after each wave's peak, most countries removed restrictive measures (e.g., travel restrictions, lockdowns, home working), re-allowing the spread of the virus, e.g [2]. The last wave of the spread of COVID-19 was recorded in China in December 2022.
This contest needs a wide-ranging, short- and medium-term Action Plan to address the health and economic crises. It should be everyone's goal to encourage a “new normality” to develop long-lasting economic growth. Indeed, the “new normality” should start with safe mobility, which should respect the rules of social distancing, and should avoid gathering people, especially within urban areas. The central role of physical distancing policies in reducing the spread of the virus has been clear since the start of the pandemic [3-5], but it is very challenging in group situations such as those of public transport, schools and workplaces. Within this topic, many studies have observed a direct influence (correlation) between mobility habits and the spread of COVID-19, especially in the phase in which many retail businesses reopened, e.g [6-9]. Likewise, it should be considered that the COVID-19 outbreak dramatically impacted people’s lives, significantly changing daily habits, and this has significantly affected the transport and mobility sectors, e.g [6, 8]. The users have changed their habits and mobility choices during the pandemic, e.g [10-13], but also after periods of lockdown where some restrictions are lifted, e.g [14-18]. Investigating mobility choices before and after the pandemic was an important task to carry out to define the critical issues that could have been encountered during the “new normality” after a pandemic period and identify mobility strategies suitable for the specific territorial context. Investigating how public transport users would change their mobility choices after a pandemic made it possible to identify the main Public Transport (PT) users’ worries about avoiding a high modal shift towards private cars during the “new normality.”
This paper aims to assess the effect of COVID-19 on the mode choice of “regular PT users” and identify mobility policies aimed at fostering the use of local Public Transport (PT) w.r.t. the safety regulations in force during the “new normality” after the pandemic period, using a case study from the city of Naples. “Regular PT users” refers to the local passengers before COVID-19, i.e., those Neapolitans that used PT at least once a month before the start of the pandemic.
A mobility survey aimed at regular PT users was carried out to achieve these objectives, in April 2020, in Naples (South of Italy), a few weeks before the end of the lockdown and the beginning of the so-called “phase 2” (4th May 2020), in which trips and activities were progressively allowed. Through the surveys ’results, it was possible to investigate users’ mobility choices in the hypothetical future scenario (after the pandemic) and to investigate the perceptions of the risk and safety of using PT during the COVID-19 pandemic emergency in relation to the possibility of infection. Through a Stated Preferences (SP) experiment, the Willingness To Pay (WTP) (in terms of long waiting times at terminals) was evaluated to guarantee social distancing between the terminals and the bus/train. Then, identifying the main policies in urban areas has been proposed to ensure safe trips and the activities' recovery.
The manuscript is made up of 5 sections. In section 2, the spread of COVID-19 in Italy during the first months of the emergency is reported with a specific focus on mobility impact. In section 3, the method and mobility survey carried out is described, and in section 4, the main results are shown. Section 5 presents some policy recommendations. Finally, in section 6, the conclusions and further research developments are shown [14-20].
2. THE COVID DIFFUSION IN ITALY
The COVID-19 emergency in Italy started officially in January 2020 when the Government declared a state of emergency for six months (until the 31st of July 2020) due to the COVID-19 pandemic. Over 24 injunctions were taken; some affected mobility habits directly or indirectly. Specifically, three main measures deeply affected the lifestyle of the Italians: i) the institution of Red Zones (on February the 23rd); ii) the National lockdown (on March 8th); iii) the end of the “high emergency phase” and the beginning of Phase 2 (in May the 4th) (Fig. 1).
On February 23rd, 2020, the decree on “Control and management of the COVID-19 pandemic” (February 23rd, 2020, no. 6) introduced measures to limit the contagion in Lombardy and Veneto Regions, identifying the so-called “Red Zones” where schools were closed, and all public events in the regions were stopped [21, 22]. Consequently, a decrease of between 10% and 30% in mobility trips was observed at the national level.
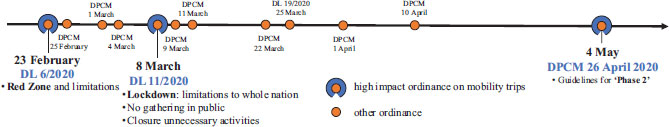
Despite a new decree on February 25th which introduced new measures to reduce the contagion due to sports events, the organization of school activities and higher education, health prevention at prisons, and regulation of access modes, the infection spread widely, and on March 8th a new decree extended the restrictions to the whole nation, introducing a national lockdown. Mobility trips dropped to 90% at the end of March and, as observed by Pepe et al. [22], the number of users who did not leave their home province increased by 50% at the national level and by more than 100% in the provinces, where contagion clusters occurred.
On March 11th, the Italian Prime Minister signed the new decree (DPCM 11 March 2020) with further measures in relation to containing and managing the pandemic emergency throughout the country, with the closure of all commercial and retail activities, except for groceries and basic needs, and chemistries. The consequence of this decree was that the distance usually travelled by users was considerably lower (49%) in the three weeks of restrictions, from 13 km to about 7 km on average. Moreover, an average reduction of 8% in potential encounters were observed during week 2 and almost 19% during week 3 [22].
A new ordinance on March 20th by the Minister of Health prevented public access to parks, play areas, public gardens, and sports or recreational activities outdoors. On public holidays and days preceding them, as well as those following them, no trips were allowed from the main residences to another. The measures taken for containment were extended until May 3rd.
After the contagion curve had fallen below the attention level, the so-called “Phase Two,” introduced by DPCM on the 26th of April 2020, reduced the restrictions of the lockdown, allowing some trips, such as: visiting relatives and partners in the same region, reopening parks and public gardens, having funerals with at most 15 persons, opening takeaway, and reopening some industrial activities. The regions were called to monitor the daily progress of the pandemic among their residents to ensure production under safe conditions. This immediately caused a partial increase in the mobility rate of almost 20% after the 4th of May. Since 4 May, the Italian government has issued a series of directives to achieve new normality, modifying the restrictions according to the contagion index (Rt) reached by the individual Regions.
2.1. The Effects on Mobility
Since the COVID-19 health emergency began, many researchers have analysed the link between COVID-19 and mobility, e.g [7-21].
During the confinement phase, the Audimob observatory [23] conducted a CATI (Computer Assisted Telephone Interview) and CAWI (Computer Assisted Web Interviewing) survey interviewing Italians aged between 14 and 80 years. The results showed that the mobility rate (percentage of respondents who during the day made at least one trip of any type, except those carried out on foot lasting less than 5 minutes) decreased by almost 53%. However, the drop was more evident in the central Italy regions and contained in those of the South [23], where the spread of the virus during this first wave was more controlled. The average number of daily trips per capita decreased significantly from an average of 2.14 in 2019 to a value of 0.70 during the lockdown period; the number of kilometres travelled on average in a day also decreased from 11.2 km in 2019 at 5.8 km, a reduction of 48% [24]. In 2019, the flows of mobility generated, on average, every day, 103 million trips, a value that decreased to 34 million in the lockdown period with a 67% reduction compared to 2019 [23, 24]. As for the distances travelled (passengers * km) in 2019, the daily demand volume was 1,210 million km, a value that decreased to 84% during the confinement phase (197 million). However, it should be considered that trips outside the residence municipality were forbidden except for work or health purposes.
During the lockdown, non-motorized mobility had a significant increase (+ 12.9% during the first 30 days of the lockdown and + 9.8% during the entire period), and motorized mobility had a marginal increase. The use of PT during the lockdown phase drastically decreased (-90%).
The reduction of travel frequencies caused by COVID-19 was also due to smart working activities, which had a 300% increase compared to 2019 [25]. The use of smart working led to a new vision of its potential. Indeed, many companies decided to keep promoting this way of work in the future, trying to improve its efficiency thanks to the reduction of workers' travel times and stress levels and thus increasing productivity [25]. Around 66% of the respondents would choose smart working in the future [24]. In 2022, Italy had over 3.6 million smart workers [26].
Between April and May 2020, a survey [27] was carried out among a panel of chief executive officers of industries, consultancies in the mobility sector and PT companies showed a consensus about supporting local PT not only to preserve a strategic sector for urban mobility but also because an unexpected increase of trips by cars could lead to a high level of road congestion with severe consequences on the environment (landscape and air quality) and people’s quality of life. In the medium term, the solutions that gained more consensus within the panel were related to the reduction of the demand levels by adopting, wherever possible smart-working solutions and by smoothing the demand peaks by differentiating the times of the activities in the cities (e.g., schools, offices, shopping).
Starting with the results observed during the first phase of the pandemic, this manuscript analyzed the effects of COVID-19 on the users’ mobility choices during “new normality” and proposed new urban policies.
3. METHOD: A SURVEY TO ESTIMATE MOBILITY HABITS IN THE POST-COVID-19 ERA
To identify the main strategies to be adopted for an efficient and safe public transport service during the “new normality” after a pandemic, the first phase of the research has investigated the new constraints to the use of PT due to the COVID-19 disease and to evaluate the effects of COVID-19 on passenger loyalty.
To achieve these objectives, a mobility survey has been employed with the aims: i) to assess the users’ mobility habits before the COVID-19 pandemic, ii) to evaluate the attitudes to keep on using PT after the lockdown, iii) to identify the attributes related to the reluctance (e.g., fear of contagion, service uncertainty) to continue using PT and the main characteristics that PT should have to be perceived as a safe transport alternative.
Investigating mobility choices before the pandemic was an important element in defining the critical issues that could have been encountered during the “new normality” after a pandemic and identifying mobility strategies suitable for the specific territorial context.
Investigating how public transport users would change their mobility choices after a pandemic, during the “new normality,” made it possible to identify the main PT users’ worries about avoiding a high modal shift towards private cars during the COVID-19 pandemic.
Therefore, the questionnaire submitted to users was divided into four sections. Section 1 collected the socio-economic characteristics and mobility habits (trip frequency, main destinations) pre-pandemic. In this section, each respondent was asked about their mobility habits (e.g., trip frequency by Public Transport) pre-COVID-19 period, relating to the work and study trips and for other trips over which travelers have more discretion, such as shopping, socializing, etc.
In section 2, the hypothetical future users’ mode choices were analysed. Hypothetical future mode choices are investigated subject to the mobility habits pre-COVID-19. e.g., users in Section 1 declared that pre-COVID-19, they chose PT only for work and study trip purposes; in Section 2, future choices are investigated only for work and study trip purposes.
In section 3, the desired characteristics of the PT service were investigated. In the last section of the questionnaire, the willingness to wait for the local PT service to guarantee social distancing was asked through a Stated Preference (SP) exercise. The SP survey was employed, sampling travellers from the market segments with a better knowledge of PT. To overcome the limitation of SP surveys related to the reliability of users’ responses to hypothetical scenarios and to reduce the potential justification bias of the response (e.g [28-30]), the respondents were PT frequently users. To each respondent, three scenarios were submitted to limit the fatigue effects that could distort the quality of results (e.g., the seminal works of Hensher et al. [31], and Pearmin et al. [32],). The generic scenario varied from the actual travel experience to the waiting time scenario of + 5 minutes (about 50% more than the average waiting time in 2019, pre-COVID pandemic),+ 10 minutes (about 100% more than the average waiting time in 2019), + 20 minutes (about 200% more than the average waiting time in 2019). For each hypothetical scenario, each user was asked if they could wait for 5, 10, 20 minutes more for the local PT service respecting the social distance of 1 meter on board (bus or train).
The questionnaire was submitted during the first phase of the pandemic (when Italy was in lockdown) to the residents of the province of Naples selecting a sample of local PT users. The case study is of interest; the province of Naples is the one with the highest population in Europe, with about 3 million people and with a density of 2,672 people/Km2; being an area densely populated, the problems related to travel health safety in local PT are particularly relevant. Furthermore, the inhabitants of the province of Naples own around 2 million cars (The province of Naples is one of the highest car ownership rates in Europe).
Regular PT users were interviewed since they had a better knowledge of the weaknesses and strengths of PT.
The survey was carried out through a CAWI (Computer Assisted Web Interview) method with the support of the social channels of local public transport (official web pages and social channels such as Facebook and Instagram were used to disseminate the questionnaire) in the city of Naples. Over 14 thousand users residing in Naples were interviewed (the 4% of daily travel demand by Public Transport in the Naples provinces). The sample interviewed was stratified considering the socio-demographic characteristics of the Neapolitan traveler (population). The proportions of the socio-demographic characteristics (i.e., the distribution of the Neapolitan traveler) were obtained through the overall survey on the mobility of the UnicoCampania Consortium, with the aim also of defining (and monitoring over the years) the “identikit” of the PT traveler. This survey shows that the socio-demographic composition of the sample survey travelers is comparable to that observed for the Neapolitan traveler Table 1. Specifically, 54% were women (from the population distribution, 59% are women), and 33% lived in the municipality of Naples (according to population distribution) (Table 1).
| Sample Socio-economic and Travel behavior Characteristics | ||||||
|---|---|---|---|---|---|---|
| Category | Number | % | Population Distribution |
|||
| Gender | - | - | - | |||
| Male | 6,453 | 45.7% | 40.5% | |||
| Female | 7,667 | 54.3% | 59.5% | |||
| Residence | - | - | - | |||
| Naples municipality | 4,716 | 33.4% | 31.3% | |||
| In the rest of the province of Naples | 9,404 | 66.6% | 68.7% | |||
| Age | - | - | - | |||
| 14-18 | 946 | 6.7% | 5.9% | |||
| 18-25 | 5611 | 39.7% | 38.5% | |||
| 26-40 | 3297 | 23.4% | 24.5% | |||
| 41-60 | 3303 | 23.4% | 24.8% | |||
| >60 | 960 | 6.8% | 6.3% | |||
| Total Sample size | 14,120 | - | - | |||
| Category | Observations Number | % | ||||
| Trip purpose | - | - | ||||
| Work and Study Trips | 14,120 | 65.4% | ||||
| other trips (e.g., for leisure, shopping, visiting relatives and friends) | 7,189 | 33.3% | ||||
| Prefer not to say | 281 | 1.3% | ||||
| Total Sample size | 21,590 | - | ||||
| Work and Study Trips | ||||||
| <1 time a week | 339 | 2.4% | ||||
| 2 times a week | 579 | 4.1% | ||||
| 3 times a week | 2,019 | 14.3% | ||||
| 4 times a week | 2,513 | 17.8% | ||||
| 5 times a week | 5,380 | 38.1% | ||||
| >5 times a week | 3,290 | 23.3% | ||||
| Ticket | - | |||||
| One way | 875 | 6.2% | ||||
| Monthly Subscription | 2,175 | 15.4% | ||||
| Annual Subscription | 9,898 | 70.1% | ||||
| Other | 1,017 | 7.2% | ||||
| Prefer not to say | 155 | 1.1% | ||||
| Total sample size | 14,120 | - | ||||
| - | Other Trips | - | ||||
| Trip frequency | - | |||||
| <1 time a week | 2,530 | 35.2% | ||||
| 2 times a week | 1,826 | 25.4% | ||||
| 3 times a week | 1,057 | 14.7% | ||||
| 4 times a week | 439 | 6.1% | ||||
| 5 times a week | 575 | 8.0% | ||||
| >5 times a week | 762 | 10.6% | ||||
| Ticket | - | |||||
| One way | 733 | 10.2% | ||||
| Monthly Subscription | 316 | 4.4% | ||||
| Annual Subscription | 5,982 | 83.2% | ||||
| Other | 86 | 1.2% | ||||
| Prefer not to say | 72 | 1.0% | ||||
| Total sample size | 7,189 | - | ||||
4. RESULTS
Over 14 thousand users residing in the province of Naples were interviewed; 100% of users interviewed used local PT at least once in January 2020 (the month before the start of the pandemic in Italy) with a high frequency (Table 1), only 3% stated that they rarely used local PT (i.e., less than four times per month). Furthermore, 94% of the users interviewed stated that they used PT for work, study, and other trips (e.g., shopping, leisure, visiting relatives and friends, etc.). Considering that each respondent was asked for information relating to the work or study trips and/or relating other trips by PT, a total of 14 thousand observations were collected for passengers traveling pre-pandemic by PT for study and work purposes and more than 7 thousand observations were collected for those travelling for other purposes.
The results of the surveys presented in this study are divided into work and study trip purposes and for other trips because the travel behaviours are different.
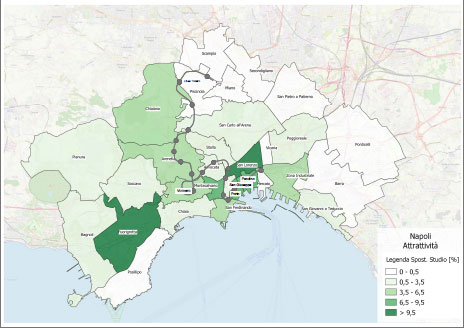
Analysing the observations collected for work or study trip purposes, it emerges that 60% of trips on an average weekday reached the municipality of Naples. The results are consistent with the Mobility Plan of the municipality of Naples [33].
The most attractive boroughs were those of Fuorigrotta (location of scientific faculties), San Lorenzo (historical centre of the city), the industrial area located along line 1 of the Naples metro system (Fig. 2). The average distance of study and work trip is 24 km, in line with the results of research conducted for the university student in Naples [34].
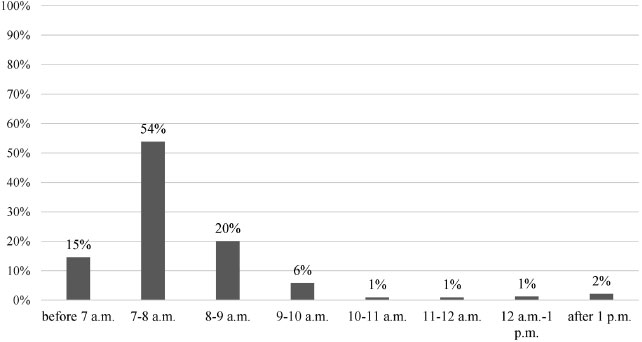
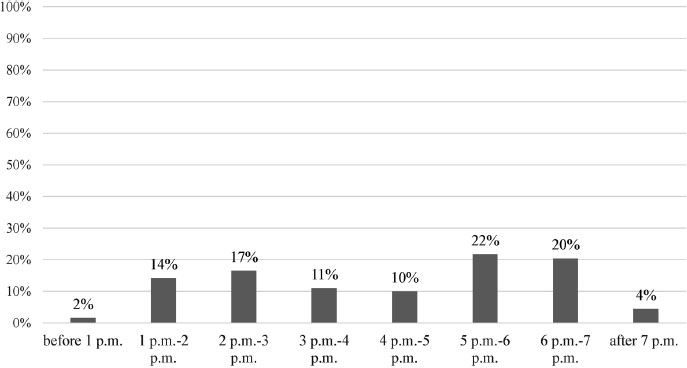
Another interesting piece of information emerging from the first part of the survey is the departure time of the trips for work and study purposes. As shown in Fig. (3), almost 54% of them occurred between 7 and 8 a.m.; therefore, more than 7,625 users travelled during this period. This leads to overcrowding of local PT in the morning. Instead, the usual return time was spread more in the afternoon from 2-6 pm (Fig. 4).
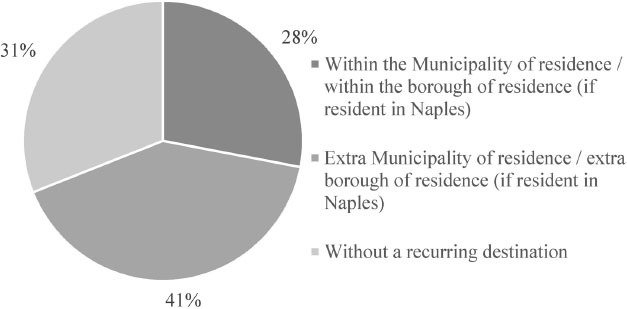
Concerning other trips, 28% of users declared that the main destination was within the municipality of residence (or to the neighbourhood if the trip origin was in the municipality of Naples); 41% had a main extra-common destination, and 31% said that they had not a recurring destination (Fig. 5).
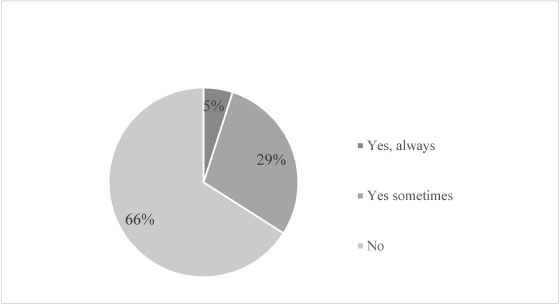
Finally, 66% would not have a car available for work and study trips (Fig. 6).
In the second section of the questionnaire, the hypothetical future users’ mode choices were analysed.
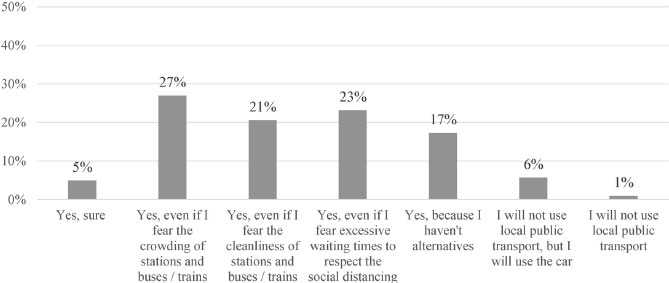
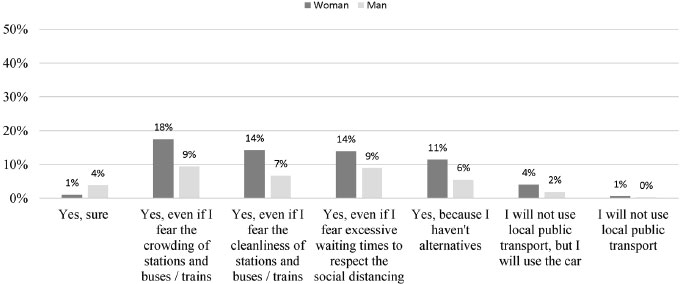
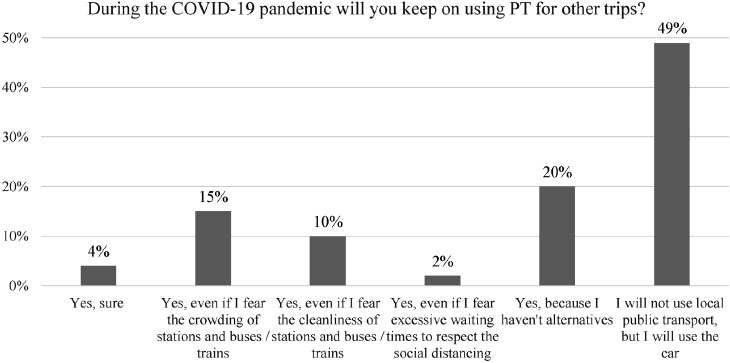
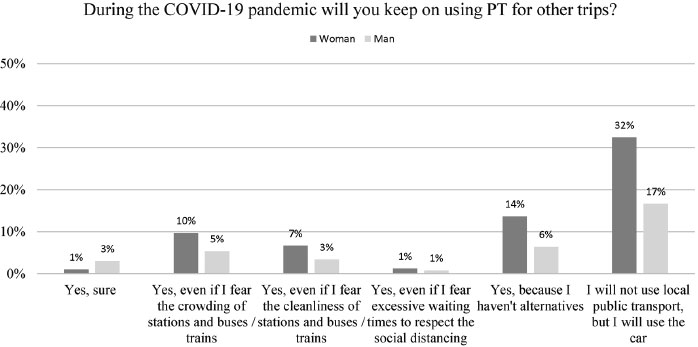
The results show that for work and study trips purposes, 6% of the users, who previously travelled with local PT, would shift to private transport (Fig. 7). This means that in one month, in the province of Naples, there would be over 54 million more trips on a private car with the subsequent effects on congestion and environmental pollution of the area. It is also interesting to note that 91% of users who travelled for work and study purposes declared that they would continue to use PT despite the widespread concerns about sanitation and crowding of stations and buses/trains. Of these, 17% declared they would continue using PT because they did not have an alternative transport mode. Women seem to feel the most fear in using PT during the COVID-19 pandemic emergency; 5% declare that they will not use the PT for work and study trips (Fig. 8) (32% for other trips) (Figs. 9 and 10) vs. 2% (17% for other trips) of men.
Young people (14-18 years) are those who, with the greatest conventions, declare (they answered: “Yes, sure”) that they will continue to use PT in the new normality both for work and study trips (Table 2) and for other trips (Table 3).
| - | - | I will not use Local Public Transport | Yes, Sure | Total |
|---|---|---|---|---|
| Age | 14-18 | 44% | 56% | 100% |
| 18-25 | 76% | 24% | 100% | |
| 26-40 | 72% | 28% | 100% | |
| 40-60 | 59% | 41% | 100% | |
| >60 | 63% | 37% | 100% |
| - | - | I will not use Local Public Transport | Yes, sure | Total |
|---|---|---|---|---|
| Age | 14-18 | 45% | 55% | 100% |
| 18-25 | 76% | 24% | 100% | |
| 26-40 | 72% | 28% | 100% | |
| 40-60 | 58% | 42% | 100% | |
| >60 | 63% | 37% | 100% |
For the trip purposes of leisure and shopping, the loss of passengers on local PT is even more evident. Indeed, 49% of the users interviewed stated that they would no longer use local PT (Fig. 9). The modal changes estimated for the city of Naples were compared with the main results recorded in the rest of the world. Across the world, from Australia [35] to Spain [36] and Chicago [37], travelling by car, especially for other trips purpose, increased after the lockdown period.
The third and fourth parts of the questionnaire were the same for all users; therefore, there was no distinction between trip purposes because this section aimed to investigate perceptions of risk and safety in using PT during the COVID-19 pandemic emergency in relation to the possibility of infection. Each user interviewed was asked to judge some characteristics, on a scale from 1 to 3 (More important, Desirable, Indifferent), that the PT service should have during the “new normality” (Table 4).
Among the most important characteristics that users declared that the local PT service should have during the pandemic period were: frequent sanitation and disinfection of vehicles and stations (92% of respondents), mandatory use of masks and gloves on board vehicles (88%); controlled reduction of the crowding of vehicles and stations/stops to ensure the social distancing of 1 meter between passengers (80%); mobility information service on the conditions of access to services on real-time (52%).
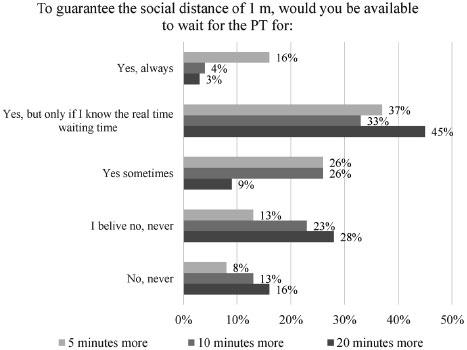
In the last part of the questionnaire, through the SP exercise, the Willingness To Pay (WTP), computed in terms of longer waiting time at terminals, was evaluated to ensure social distancing within the terminals and the bus/train. Social distancing measures were one of the primary tools to reduce the transmission of the severe acute respiratory Coronavirus [38].
The results show (Fig. 11) that 57% of users would be willing to wait up to 20 minutes more (sum of users who responded “yes,” “yes, but only if I know the real-time waiting time,” and “yes sometimes”) the bus and the train to guarantee the social distancing. Among them, 3% were under any conditions and 45% only if they could count on reliable information on the waiting time and social distancing. This result shows that users fear using PT during the COVID-19 pandemic emergency in relation to the possibility of infection.
Table 4.
| More Important | Desirable | Indifferent |
|---|---|---|
| Frequent sanitation and disinfection of vehicles and stations (for 92% of respondents) | Body temperature checks with thermal scanners at the station entrance (for 53% of respondents) | Purchase of travel tickets via APP and smart access systems (electronic tickets, APP, credit cards) (for the 28% of respondents) |
| Mandatory use of disposable masks and gloves on board vehicles (for 88% of respondents) | Dedicated mobility information service on the conditions of access to services and turnout in real-time (for 52% of respondents) | Walk a few minutes than before to reach less crowded stations/stops (for the 27% of respondents) |
| Controlled reduction of the crowding of vehicles and stations/stops to ensure the social distancing of 1 meter between passengers (for 80% of respondents) | Mobility information service dedicated to the conditions of access to services and with the possibility of booking and purchasing via APP (for the 40% of respondents) | - |
| Presence of control personnel at the station and on board the vehicles (73% of respondents) | Wait a few minutes longer than in the past, provided you have a guaranteed seat on board (for the 40% of respondents) | - |
| Disinfection dispenser at the station and on board the vehicle (for 68% of respondents) | - | - |
The results of this survey are particularly interesting because they give information (also on the time and destinations mostly chosen by users for work and study trips) regarding the mobility in the territory under study and are functional to the identification of the mobility actions and policies to be adopted in the “new normality,” after a pandemic.
5. POLICY RECOMMENDATIONS AND DISCUSSION
To enhance the use of PT, it will be necessary to reassure its safety thresholds. Indeed, evidence from the Italian case study shows that the perception of unsafety in using PT, unlike car and travelling on foot [23]: on a scale of 1 to 10, both trips with private cars and on foot are perceived as very safe (8.7 and 7.3 as an average rating), the scores of all PT do not exceed 3.5 on average. Coppola and De Fabiis [27] proposed a graph in which the sustainability and effectiveness of different measures that can be taken for public transport are compared. Starting the results obtained by Coppota et al. [27, 39] and the investigations conducted in this research (see section 4), a graph in which the sustainability and user desirability of different measures for PT during the “new normality” are compared in Fig. (12) it has been reported.
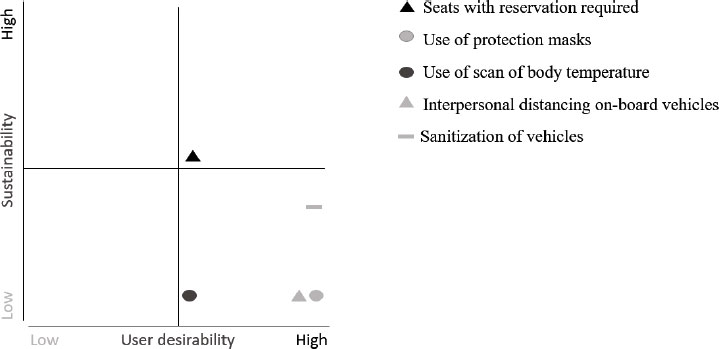
The scan of the body temperature of passengers and the sanitization of vehicles are all seen by Neapolitans passengers as desirable measures, but these are measures not sustainable, particularly for the additional operating costs to be borne by PT companies and by the lack of personnel to be allocated to this task.
Keeping the interpersonal distancing measures onboard the vehicles is difficult to be implemented on the metro or bus since it requires an access control system either on-board the vehicle or at the station, with additional costs for the PT operator. These measures can be achieved using an intelligent transportation system (ITS). Smart mobility, using new technology (e.g., ICT, IoT and RFID technologies), involves benefits, such as [40] improving access to information, facilitating intermediation between providers and users, facilitating payments, and increasing trip convenience. So smart mobility is very handy in the “new normal” period. Half of the users interviewed in Naples believed that all policies related to smart mobility (e.g., dedicated mobility information service on the conditions of access to services and turnout in real-time, information service dedicated to the conditions of access to services and with the possibility of booking and purchasing via APP) are particularly desirable for the PT (Table 2, section 4).
Moreover, keeping the interpersonal distancing measures on board the vehicles implies that when the demand flows exceed vehicle capacity, travellers might experience additional waiting time due to queues to access platforms and/or vehicles. In general, the occurrence of these problems can either discourage travel or divert users to other modes of transport, but the results of this research show that users would be willing to wait for up to 20 minutes more on the bus and the train to guarantee social distancing. Users are willing to wait longer if they can count on reliable information on the waiting time and social distancing. Therefore, Info mobility is one of the main characteristics that PT should provide in this particular historical period to guarantee the reliable quality of service.
In conclusion, the main actions that could be implemented to mitigate possible crowding are:
- − The introduction of advanced traveller’s information systems to monitor in real-time trains/stations inflows and outflows and to inform travellers about possible service unavailability or presence of queues due to overcrowding, using both electronic displays installed at bus stops/stations and mobile travel apps [41];
- − The introduction of seat reservation systems to access trains and/or stations, similar to those for ex-urban services.
These measures could help to manage the demand peak periods, but at the same time, in the case of recurrent over-crowded trains, they could induce a modal shift towards other modes and services due to the unreliability of service travel times (in particular, waiting times). In principle, a way to counterbalance the reduction in vehicle capacity might be to increase service frequency. However, in many cases, lines are already operated at full capacity (e.g., during peak periods). There is no spare infrastructure capacity or a lack of additional vehicles and drivers. In any case, increasing service frequency would have an additional cost for PT companies that could be unbearable. Indeed, it has to be considered that operators have already experienced a significant drop in demand due to COVID-19 and consequently in ticketing revenues, together with an increase in sanitization and cleaning costs, to maintain the highest hygiene standards during service hours.
More solutions to be implemented by public authorities could be those of:
- Reducing demand levels by promoting working from home and/or distance learning for school and university students. This measure would undoubtedly reduce the mobility volumes, but also ticketing revenues for PT operators, thus requiring additional public subsidies;
- Smoothing the demand peaks by spreading the demand volumes over the day. This measure would seem particularly useful for the case study; in fact, the results of the investigations show that more than 7,625 people (54% of users for work and study trips) travelled between 7 and 8 a.m. (Fig. 3> section 4). This measure could be implemented by changing the access/egress times of the schools, introducing differentiated schedules in offices and factory working hours, and changing activity times in the cities (e.g., shopping, public services, medical care). This would induce deep changes in households' habits and daily routines, probably generating strong opposition by communities or workers' associations in some cases, thus requiring strong political commitment and administrative actions.
- Finally, it is worth mentioning that in an emergency, a key aspect for the successful implementation of any policy and actions is citizens’ and stakeholders’ participation in the decision process. Any policy should be shared and agreed upon with the stakeholders who would be highly affected by the measures (e.g., transport operators, school representatives, shop owners, etc.). Also, policy actions should be timely and clearly communicated to people.
Participating in the discussion about specific transport and accessibility issues has improved the overall stakeholders’ knowledge of the problems (see, for instance, Papa et al. [42]). It could help to take effective, better and conscious decisions.
While communication has been very much taken care of, we believe that the involvement of the stakeholders (and in some cases also of the local institutions and administrations) has been missed during the pandemic. This represents an aspect of being improved in the future management of emergencies.
CONCLUSION AND FUTURE PERSPECTIVES
During the COVID-19 pandemic, several changes in travel behaviour have been registered, and their analysis deserves attention. A reduction in the number of trips (with an increase in teleworking) for study and work purposes and an increase in car trips were recorded in all cities worldwide. PT, defined as the green, sustainable mode of transport, has been considered one of the causes of the spread of COVID-19, generating fear for transport users who returned to their activities in the post-lockdown phase. In this paper, a mobility survey was carried out in Naples (Italy) a few weeks before the end of the lockdown. Over 14 thousand users residing in the provinces of Naples were interviewed, and a total of 14 thousand observations were collected for users travelling for study and work purposes and more than 7 thousand observations were gathered for users travelling for other purposes.
With this survey, evidence was obtained on the changes in mobility: increased use of private transport (especially for leisure, shopping, visiting relatives and friends trips over which travelers have more discretion) and fear about using PT during the COVID-19 pandemic emergency in relation to the possibility of infection. Starting from these results, a series of measures aimed at improving PT during the new normality were identified for a case study of this research. Social distancing, recognized as the main intervention to limit the spread of COVID-19, should, however, be accompanied by a series of initiatives, such as the use of new technologies (smart mobility) to reduce disutility for users (e.g., extra waiting time) and to help local PT companies to manage the station and stop flows. New technologies should also be used to implement measures reducing peak demand. In Italy, several pilot projects have been proposed in the main cities (such as Cagliari, Naples, Turin and Bergamo) which, through the use of different technologies (like sensors at the entrance to stations or Bluetooth and WiFi detectors), allow counting the number of users and then analysing the crowding on board. In some cases (such as the Cagliari CTM Pilot Project), through the use of an App (in the case of Cagliari App BusFinder - BF), information is also provided to users on the degree of crowding in real time of the different transport modes.
An interesting issue that should be further investigated concerns the future economic and employment scenarios. Indeed, this pandemic has brought several impacts on the economy at the global level. The following aspects should be investigated: general recession, tourism crisis, smart working, business travel decrease, and better work organization. During the lockdown, workers have experienced more time to organise meetings at any time of the day and week, including Saturdays and Sundays. Once the pandemic is over, more and more video conferences will be valued, spending less time and money on unneeded journeys.
LIST OF ABBREVIATIONS
| PT | = Public Transport |
| ITS | = Intelligent Transportation System |
| CAWI | = Computer-Assisted Web Interview |
CONSENT FOR PUBLICATION
Not Applicable.
AVAILABILITY OF DATA AND MATERIAL
All the data and supportive information are provided within the article.
FUNDING
None.
CONFLICT OF INTEREST
Dr. Ilaria Henke is the Editorial Advisory Board member of The Open Transportation Journal.
ACKNOWLEDGEMENTS
Declared none.

