All published articles of this journal are available on ScienceDirect.

The Impact of Cognition-affecting Neurological Diseases on Reaction Time and Driving Speed Deviation
Abstract
Background:
Globally, more than 322 million people are living with depression, with a considerable percentage driving while under the effects of such impairments. Their impacts on specific parameters of driver behavior and road safety, such as driver speed and reaction time, however, remain understudied. The literature indicates that driving performance deteriorates in patients with depressive symptoms, causing increased crash probability and more aggressive behavior.
Objective:
The objective of this research was to examine the influence of neurological diseases on driving performance, and particularly, how depression affects reaction time and the standard deviation of driving speed.
Methods:
Data were obtained from a large-scale simulator study comprising 12 driving urban and rural trials. The sample consisted of 113 impaired participants, suffering from mild cognitive impairment, Parkinson’s disease, Alzheimer’s disease, and depression, and 92 people with no cognitive impairments as the control group. Inclusion criteria comprised having a driving license and driving experience (≥3 years), being active drivers, not having critical psychosis, eye or motor disorders, and not having drug/alcohol addictions.
Results:
Analysis of cognitive impairments based on GDS questions showed that frequent ‘feelings of boredom’ correlated with a 7% increase in reaction time and a 8% increase in the standard deviation of driving speed. Conversely, ‘feelings of worthlessness’ reduced the standard deviation of driving speed by 4.5%. ‘Feeling full of energy’ contributed marginally significant increases to reaction times of 4%. Drivers with Alzheimer’s and Parkinson’s diseases showed higher reaction times, while drivers with depression and the control group showed lower reaction times. Drivers with Parkinson’s disease showed statistically fewer deviations of average speed.
Conclusion:
This research shows that cognitively impaired individuals have larger reaction times and more erratic driving speeds. Present findings can be used to inform both patients and authorities of their driving behavior and can be considered when (re)issuing driving licenses.
1. INTRODUCTION
Each year, road traffic crashes cause the death of more than 1.3 million people (90% in developing countries), while 20 to 50 million people’s injuries or disabilities result from crash involvement. Accordingly, road traffic injuries are the largest contributor to death among children and adolescents between the ages of 5 and 29 years [1].
Speeding is known to play a major role in crash occurrence. Specifically, for every 1% increase in mean speed, a 4% increase in the risk of a fatal crash is marked [1]. Another 65-95% of road crashes are estimated to occur because of human factors. In this case, neurological diseases, such as mild cognitive impairment (MCI), Parkinson’s disease (PD), and Alzheimer’s’ Disease (AD) can affect driving performance as a result of the impairment of cognitive functions. This phenomenon is more frequent among the elderly. Driving errors, such as unreasonable sudden brakes, high lateral position variability, delayed reaction time, etc., are linked to those neurological diseases as well [2].
In 2019, road injuries were at the 12th position of global causes of death, and 19th for years lived with disability (YLD) [3]. As for non-fatal health loss, depressive disorders take the lead (5.7% of all YLD) across the world. In Greece, 5.7% of the population (in terms of prevalence rates) is living with depression, while the total YLDs account for up to 9.1% [4].
Depressive disorders (such as major depressive disorder/depressive episode and dysthymia) can affect a person’s mood, interest/pleasure, energy, self-worth, and ability to concentrate. Managing everyday life and daily tasks may need strenuous efforts, while severe depression can lead to suicide [5]. There is a total of 322 million people living with depression worldwide. From 2005 to 2015, there has been a rapid increase in the global population with depression by 18.4% [4].
Considering that depression affects daily tasks and concentration, further examination is significant in order to disambiguate whether and to what extent it affects driving performance and behavior. Other potential normal driving errors and pathological factors (neurological diseases that cause impaired cognitive functions) may attribute to incompetent driving mechanisms, thereby leading to unexpected incidents.
Contributing to the already existing knowledge, this article is expected to provide new insights into these topics by conducting a multilevel analysis investigating the impacts of neurological and depressive conditions, thus improving the overall understanding of the manifestation of poor driving performance. Such results may contribute to traffic engineering, aiding more human-factor-oriented designs and promoting the safe system approach [6, 7] and the awareness of the neuropsychological domain.
2. LITERATURE REVIEW
A literature review was conducted in order to retrieve original articles, published in English, which present studies conducted on driver assessment and evaluating its direct association with neurological diseases that affect cognitive functions and, as a result, driving performance. Keywords, like MCI, AD, PD, depression, driving performance, driving behavior, driving errors, reaction time, average speed, cognitive functions, and visuospatial working memory, were used to retrieve relevant and complementary articles via web search engines, such as TRID, PubMed, Scopus, ResearchGate, and Google Scholar.
2.1. Neurological Diseases (MCI, AD, and PD) Affecting Cognitive Functions and Driving Performance
Overall, studies have shown that neurodegenerative diseases, such as MCI, AD, and PD may result in a gradual decline in driving abilities, posing significant road safety risks and leading to an increase in crash occurrence [8, 9].
Specifically, MCI refers to cognitive and functional impairments and constitutes the intermediate stage of normal aging and AD. AD is a chronic neurodegenerative disease that gradually weakens patients’ memory and accounts for 60% to 70% of cases of dementia. PD is a degenerative disease of the central nervous system that is typically identified as a motor disorder [2]. There are, also, non-motor symptoms, such as visual and cognitive dysfunctions and increased daytime drowsiness that affect driving [10].
In a relevant study, 46 participants with MCI and 59 cognitively normal controls, recruited to the Alzheimer’s Disease Research Center (ADRC), were tested for driving skills (including right turn, left turn, lane control, gap judgment, steer steadiness, maintaining speed, and global rating). MCI participants were evaluated with less than optimal ratings on every variable, except right-hand turns and steering steadiness, where no significant differences were noted between the two groups [11]. In another study, the impact of neurological diseases that affect cognitive functions and driving performance (speed, lateral position, steering angle, headway, reaction time at unexpected events, etc.) was assessed in different driving scenarios (neurological and neuropsychological assessment). In total, 75 people participated (14 AD patients, 23 MCI patients, and 38 healthy control group participants) in this study. The results suggested that cognitively impaired individuals performed significantly worse; displaying significantly lower speeds, larger headways compared to cognitively intact drivers, difficulties in positioning the vehicle on the lane, and longer reaction times [12].
Visual processing was investigated (useful field of view test) in a group of 302 drivers in Alabama, who were selected based on the number of recent crashes. This longitudinal research revealed that the mental status of the follow-up study compared to that of the initial study did not constitute a predictor of crashes during the 3 years of follow-up. Although the unexplained variance in crash rates in an elderly population may occur due to visual processing combined with impaired mental status, the combination did not forecast future crashes [13]. This study demonstrates substantial problems with visual processing present in drivers with AD.
There is clear evidence that AD patients have an increased risk of motor vehicle collision as opposed to age-matched controls, stacked up against PD patients, where no real risk is defined. To assess driving ability in various neurological conditions (AD and PD) and foretell hazardous driving in AD patients, 61 AD drivers and 115 elderly controls were tested in terms of visual perception, speed of processing and attention, memory, visuospatial/constructional abilities, mobility, and executive functions within the framework of an earlier study. In all neuropsychological tests (CFT, JLO, TMT-B, etc.), AD patients showed severe deficits, while PD (mild-to-moderate stages) patients exhibited more specific and discrete alterations, especially in executive and visuospatial functions [12]. It should be highlighted, however, that these effects are not always straightforward and might take time to manifest [14] or may include large variability of the driver group with conditions, with some patients performing adequately in a non-distinguishable manner [15].
2.2. Effects of Depression on Driving Performance
The impact of depression on driving performance and safety is a matter that has not been extensively researched. However, an association between depression and crash risk has been noted, according to the studies that have been completed to date [16, 17]. According to a few experimental studies using on-the-road performance or simulation, depressed drivers struggle with reaction time, divided attention, reaction to changing speeds when following another vehicle, and weaving within the lane. Those difficulties may be a contributor to increased collision risk [18]. Furthermore, according to epidemiological studies, whose center of attention is drivers that experience psychological distress or depression, the drivers engage in more risky and aggressive driving behavior [19] due to fatigue, sleep disturbances, and defensive mechanisms. Moreover, depression nearly doubles the risk of involvement in a car crash, according to a recent meta-analysis based on pooled data from six studies [16].
In addition, in a cohort study in which 800 bus and truck drivers participated and whose aim was to identify if personality traits, some mental illnesses (depression, obsession, PTSD, etc.), and driving behavior have an impact on the risk of road crashes, the data showed that depression (minor/mild/ major) increased the odds of road crashes by 2.4 times [20]. This underlines the impact that depression has on cognitive abilities and psychomotor functions. Depression may negatively affect problem-solving, attention span, the ability to multitask, decision making, concentration, and reaction time [16].
In a quasi-experimental simulation study, 18 outpatients diagnosed with major depressive disorder demonstrated slower steering reaction times and a greater number of crashes compared to the 29 control participants [21]. A cluster analysis of personality and driving-related measures conducted by Deery and Fildes [22] showed 198 depressed, young novice drivers with more depressive symptoms to exhibit greater difficulty in dividing attention between competing driving-related tasks.
Severe depression, as previously mentioned, may also lead to suicide. There is a possibility that a car collision may occur intentionally as a result of self-harm. This motor vehicle crash may disguise suicidal intent. Lastly, the side effects of anti-depressants and other psychoactive drugs (drowsiness and interactions with other medications) are also associated with elevated crash risk. Alertness, concentration, cognition, and driving performance may be impaired since those drugs act on the central nervous system. The fitness to drive (FTD) of individuals with depression may also be influenced by benzodiazepine use [16].
As determined by the literature review process, it is very fruitful to investigate aspects of the driving behavior of patients suffering from neurological and depressive conditions, especially given the lack of research in the latter category. Therefore, in the present research, data from a large simulator study were exploited to quantify the influence of the aforementioned conditions on reaction time and average speed (in the form of its standard deviation). These indicators can be considered surrogate safety measures, and as such, they can be used to provide insights not only for the target patient groups but in any locations examined before crashes occur or in areas where crash data are scarce [23]. Surrogate safety measures can be very useful in assessing the effectiveness of experimental and existing countermeasures as well [24].
3. MATERIALS AND METHODS
3.1. Linear and Log-linear Regression
Linear regression is a very well-known technique to quantify the effect of one continuous dependent variable along with one or more independent variables (covariates), and has received wide applications in all fields of research. Importantly, utilizing linear regression implies a series of assumptions, including the fact that independent variables are assumed to be non-correlated with each other, that the modeled relationships are linear, that there is homoscedasticity in the data, and that errors follow a normal distribution. The transport-related applications have been detailed by Washington et al. [25]. In short, a linear predictor is provided for the dependent (or response) variable, which is correlated with several independent (or explanatory) variables:
 |
(1) |
Where,
- yi is the dependent (or response) variable
- xi are the independent (or explanatory) n variables
- bi is the regression coefficient of a particular xi
- b0 is the constant term
- Ɛi is the error term of the model
In times when a dependent variable assumes only positive values, such as reaction time, it is strongly recommended to model its logarithmic form instead of the absolute value. This transformation bars the model from yielding negative predictions for the dependent variable, allowing for better model fit overall. The log-linear model transformation (zi) thus can be expressed as:
 |
(2) |
The coefficient interpretation here is similar to simple linear regression.
3.2. Random Effects Modelling
In order to capture unique driving conditions as influenced by underlying medical conditions (or lack thereof in the control group), random effects can be introduced to extend the log-linear regression to mixed log-linear regression. Specifically, for the role of random effects, both random intercepts as well as slopes have been studied. The mathematical form of the MLLR for a single independent variable j of the total p with varying intercepts is presented as follows (Eqs. 3-5).
 |
(3) |
 |
(4) |
 |
(5) |
Where, i is the number of observations, j is the number of grouping levels, p is the number of independent variables, yij is the dependent variable value of the ith observation and jth group, β0 + u0j is the intercept of the jth group, β1,…,βp are the regression coefficients, x1ij,…,xpij are the independent variable values of ith observation of the jth group, εij is the random error of ith observation and jth group, and σ2 and σuj02 are the respective error variances. Consequently, the ordinary linear model has one intercept β0 for all subjects, whereas this linear mixed model with varying intercepts has a different (random) intercept (β0+u0j) for each group j [26].
3.2.1. Likelihood Ratio Test
When comparing the goodness of fit of two nested regression models (each contains a subset of the predictor variables in the overall regression model), a common likelihood ratio test is used. If the p-value of the test is below a certain significance level (e.g., 0.05), then the null hypothesis is rejected and the full model is approved. Both approaches (simple linear regression and random-effects linear regression) were calibrated using the maximum likelihood estimation (MLE) method.
4. DATA DESCRIPTION
With the aim to assess the driving performance of patients with neurological diseases that affect their cognitive functions, a large driving simulator experiment was conducted at the Department of Transportation Planning and Engineering of the National Technical University in Athens (NTUA) from March 2013 to April 2015. The main inclusion criteria comprised having a driving license and driving experience of more than 3 years, being active drivers, not having critical psychosis, eye or motor disorders, and not having drug/alcohol addictions. Further details can be found in previous studies that have utilized these data [2, 12].
The sampling scheme consisted of 225 participants, of whom 76% were males and 24% were females. An experimental group was composed of 133 patients with neurological diseases that impaired their cognitive functions; 45 with MCI (mild cognitive impairment), 28 with AD (Alzheimer’s Disease), 25 with PD (Parkinson’s Disease), and 15 patients with depression (among 35 patients with other neurological disorders that affect cognition) were tested. In addition, there was a control group that included 92 people without any cognitive disorder. The sample was considered large and representative, and the whole experimental procedure lasted two years.
The experiment involved an interdisciplinary approach and encompassed three scientific branches: driving at the simulator (12 driving trials ~ 1.5 hour), medical/neurological assessment (19 tests ~ 2 hours), and neuropsychological assessment (20 tests ~ 2.5 hours). The first one included 12 driving trials with innovative experimental designs (randomization of the order in that the participants drove the individual routes, the adequate test driving time to familiarize with the environment of the simulator, and the research on the optimum number of different driving conditions) and concerned the first assessment of the driving behavior in different driving scenarios (arranging a set of tasks into a simulator). Secondly, a complete clinical, ophthalmological, and neurological assessment was carried out in order to document the characteristics of each examined brain condition (MCI, AD, PD) of the participants. Thirdly, a wide range of cognitive functions, such as visuospatial and verbal memory, reaction time, average speed, etc., were tested by a series of neuropsychological tests and psychological-behavioral questionnaires given to the participants.
4.1. Descriptive Statistics
The sample comprised 224 adults. The majority of the sample consisted of male (64.7%) and aged (67.6%) participants. Other 13.6% were young and another 18.7% were middle-aged. 71 of the participants were female (31.6%), while 8 participants (3.7%) chose to not state their gender.
The data have been divided into quarters in order for the center and the spread to be determined, including minimum value, first quartile (25th percentile), median, third quartile (75th percentile), and maximum value.
The driving performance of neurologically impaired participants was measured by a number of variables (615). For this specific analysis, 7 continuous and 4 categorical variables were collected from the original dataset. As presented in Table 1, age, EvalSpatialAddition, sudden brakes, lateral position (average), headway (average), reaction time, and the standard deviation of average speed were the continuous variables and constituted the driving performance measures.
| Variable | Minimum | Median | Maximum | Standard Deviation |
|---|---|---|---|---|
| Age | 22 | 63 | 90 | 5.892 |
| EvalSpatialAddition | 0 | 9 | 24 | 16.889 |
| Sudden Brakes | 0 | 1 | 10 | 5.892 |
| Latera lPosition Average | 1.055 | 1.705 | 4.489 | 1.754 |
| H Way Average | 1.876 | 15.258 | 1096.582 | 0.931 |
| Reaction Time_1 | 500 | 1447 | 7267 | 210.618 |
| Std evaveragespeed | 2.311 | 11.176 | 30.257 | 667.043 |
| Evaluation Metric | EvalGDS_4 | EvalGDS_12 | EvalGDS_13 | ||||
|---|---|---|---|---|---|---|---|
| Disease | Sample | Yes | No | Yes | No | Yes | No |
| MCI | 48 (21.3%) | 35 (87.5%) | 5 (12.5%) | 33 (82.5%) | 7 (17.5%) | 37 (92.5%) | 3 (7.5%) |
| AD | 27 (12.0%) | 17 (77.2%) | 5 (22.7%) | 17 (77.3%) | 5 (22.7%) | 20 (90.9%) | 2 (9.1%) |
| PD | 25 (11.1%) | 19 (95.0%) | 1 (5.0%) | 14 (70.0%) | 6 (30.0%) | 12 (60.0%) | 8 (40.0%) |
| DEP | 15 (6.7%) | 9 (60.0%) | 6 (40.0%) | 7 (46.7%) | 8 (53.3%) | 7 (46.6%) | 8 (53.3%) |
| Control | 90 (40.0%) | 56 (90.3%) | 6 (9.6%) | 57 (91.9%) | 5 (8.1%) | 50 (80.6%) | 12 (19.3%) |
| Other diseases | 20 (8.9%) | - | - | - | - | - | - |
| EvalGDS_4 | EvalGDS_12 | EvalGDS_13 | |||
|---|---|---|---|---|---|
| Yes | No | Yes | No | Yes | No |
| 143 (63.8%) | 28 (12.5%) | 136 (60.7%) | 35 (15.6%) | 136 (60.7%) | 35 (15.6%) |
| EvalGDS_4 | EvalGDS_12 | EvalGDS_13 | |||
| Yes | No | Yes | No | Yes | No |
| 143 (63.8%) | 28 (12.5%) | 136 (60.7%) | 35 (15.6%) | 136 (60.7%) | 35 (15.6%) |
Specifically, to clarify EvalSpatialAddition, this is a parameter evaluating spatial addition through testing. The spatial addition test is part of the Wechsler Memory scale-fourth edition (WMS-IV), which is the latest one [27] and is used to assess visuospatial working memory that puts a heavy load on the executive component of the working memory schema [2].
The median age of the 205 participants ranged from 22 to 90 years old, with a median age of 63 years. The participant measure of visuospatial working memory (EvalSpatial Addition) ranged from 0 to 24 meters, and the median value was 9. As for the variable of sudden brakes, with which the quantity of sudden and unexpected brakes was measured, the drivers used the brake 1 time (median) on average. The minimum use of the brake was 0 and the maximum was 10. The headway distance had a median value of about 15s. This time distance between the front of the simulator vehicle and the front of the vehicle ahead ranged from 1.88 s to about 110 s. The reaction time continuous variable calculated the moment the driver starts to brake, when an incident appears for the first time, on the road. This reaction timespan at unexpected incidents ranged from 500 ms to 12090 ms. Lastly, the standard deviation of drivers’ average mean speed along the route was about 11.2 km/h (median). After excluding the small sections in which incidents took place, and the junction areas, drivers’ mean speed ranged from 2.3 km/h to 30.3 km/h.
Table 2 represents the incidence rate of the various diseases according to the participants’ answers on the Geriatric Depression Scale (GDS) questionnaire. Individuals who had no data for both disease specification and GDS answers were excluded from each answer.
A considerable range, i.e., 87-95% of MCI, PD, and control group participants stated that they often get bored, while a small percentage (5-6%) said otherwise. A smaller deviation was noted among depressed participants, where 60% answered yes, while 40% said no. The majority of Alzheimer’s patients (77.2%) gave an affirmative answer to the question: Do you often get bored? (4th question - EvalGDS_4).
As for the 12th question (Do you feel pretty worthless the way you are now? - EvalGDS_12), 82%-91% of MCI and control participants gave a positive answer. The same happened with 70%-77% of participants with PD and AD, respectively. Lastly, participants with depression were almost deviated in half, with 46.6% of patients answering yes to the question and 53.3% answering no.
Between 80-92% of MCI and control participants answered affirmatively to the 13th question (Do you feel full of energy? - EvalGDS_13), but only 60% of PD patients answered accordingly. Like MCI and control patients, 90.9% of PD patients said yes, while less than 10% contradicted this statement. Depressed participants were divided in the exact same way, as for the 12th question.
After removing the other diseases, 205 participants with neurological impairments were assessed. MCI was the most common neurological disease (21.4%), while depression was the least common (6.7%). AD patients were 12.05% of the sample, and PD patients constituted 11.1%. The control group represented 40.1% of the sample. The other 8.4% of the sample was not taken into consideration, since they presented some other disease.
In order to identify the neurological diseases that affect cognitive functions and driving performance, 14 neurological scales/tests, 4 specific motor speed/coordination tests, and an ophthalmological examination (2.5 hours of testing in total) were all carried out. One of the neurological scales was the Geriatric Depression Scale, which evaluated the emotional state of all participants. Among the 15 questions of the GDS, of particular interest in this study were questions 4, 12, and 13 (4 and 13 for the dependent variable Reactiontime_1, while 4 and 12 for the dependent variable StdevAverageSpeed) because of the interesting results that emerged, which stated the impact of depression on driving when combined with other variables (EvalSpatialAddition, ReactionTime_1, StdevAverageSpeed, etc.). The descriptive statistics of categorical variables are shown in Table 3.
In total, 143 (63.8%) out of 205 participants gave an affirmative answer to the 4th question, against 28 (12.5%), which stated no. As for the 12th and the 13th question, 60.7% (136) of the sample answered yes, while 15.6% (35) answered negatively. The answers of 53 participants (23.7%) with other diseases (anxiety disorder, FTD, PPA, etc.) were not taken into consideration for further analysis in this study.
5. RESULTS AND DISCUSSION
5.1. Model Development
Following the described data collection and processing, log-linear regression and random intercept models were developed for the statistical analysis of driving performance and behavior. Specifically, regression models were developed to model the influence of driving behavior parameters and parameters of neurological impairments on speed and reaction time. Reaction time is defined as the timespan between realizing an upcoming road incident and starting to brake. Log-linear models provided a better model fit, because more accurate predictions rose, with less negative frequency predictions that an unorthodox independent parameter could give. Attention was paid to ensure that no negative predictions were made [28].
Linear regression models mark a relationship between a continuous dependent variable and one or more independent variables. The random intercepts model, on the other hand, is a single grouping/cluster structure for the random effect. In the analysis, the dependent variables were continuous (driving behavior variables) and categorical (neurological diseases). The log-linear regression model was applied in order to get an overall better description of the driving errors, while cognition was being affected by neurological diseases since all the independent variables in the mathematical models were positive. Both approaches were calibrated using the ordinary least squares method.
Naturally, speed and reaction time are affected by driving errors. With the linear regression models, underlying linear relationships influenced by neurological diseases that affect cognition can be uncovered. In economics and econometrics, this analogy can be examined by models that predict prices, trading volumes, or variables with sufficiently large values, such as linear regression models [28].
After establishing the theoretical background of the models and the logarithms that were utilized in this study, the models were calibrated through statistical analysis via maximum likelihood estimation conducted in R-studio [29]. For this process, the lme4 [30] and lmtest [31] packages were critical tools. Different configurations of a number of models were tested in terms of both fixed effects and random effects parameters. To capture the uniqueness of each driver’s impairment, random effects were the most informative configuration when random intercept effects were included.
5.2. Fixed Log-linear Models
The developed log-linear model for reaction time is presented in Table 4 (statistically significant results with p-values lower than 0.05 are marked in bold):
The age of drivers and HWayAverage (driving performance measure, measured in meters) are significantly correlated with reaction time. This indicates that the driver’s age and the average temporal distance from the front of the simulator vehicle to the front of the vehicle ahead are positively correlated with reaction time at an unexpected incident, and increases in these quantities lead to increased reaction times. This also applies to both Geriatric Depression Scale questions, namely EvalGDS_4 and EvalGDS_13 variables (questionnaire, yes/no answers), which are positively correlated with reaction time (although the second only on the 10% level of significance). Specifically, when calculating marginal effects for a log-linear model, it can be determined that the exact effect of one unit change on the dependent variable is equal to exp(βi). Therefore, for EvalGDS_4, it can be seen that frequent ‘feelings of boredom’ have a statistically significant effect on reaction time, increasing it by about exp(0.071) = 1.074, namely a 7% increase approximately. Accordingly, for a 10% significance level, ‘feeling full of energy’ has a statistically significant effect on reaction time, increasing it by about exp(0.040) = 1.041, namely a 4% increase. The explanation here is that people who feel more bored may have less focus, thus leading to inherently increased reaction times, while people who feel more energetic may feel distracted and, as such, have a harder time focusing on the driving task at hand.
| Variable | Coefficient (β) | t-test Value | p-value |
|---|---|---|---|
| Intercept | 7.134 | 94.070 | <0.001 |
| Age | 0.004 | 5.371 | <0.001 |
| Sudden Brakes | -0.020 | -3.396 | 0.001 |
| EvalSpatialAddition | -0.009 | -4.031 | <0.001 |
| Eval GDS_4: Yes [Ref=No] | 0.071 | 2.678 | 0.008 |
| Eval GDS_13: Yes [Ref=No] | 0.040 | 1.743 | 0.082 |
| Lateral Position Average | -0.051 | -3.901 | <0.001 |
| H Way Average | 0.001 | 9.456 | <0.001 |
Table 5.
| Variable | Coefficient (β) | t-test value | p-value |
|---|---|---|---|
| Intercept | 2.783 | 46.281 | <0.001 |
| Age | -0.003 | -4.188 | <0.001 |
| Sudden Brakes | 0.056 | 12.361 | <0.001 |
| EvalSpatialAddition | 0.004 | 2.262 | 0.024 |
| Eval GDS_4: Yes [Ref=No] | 0.075 | 3.680 | <0.001 |
| Eval GDS_12: Yes [Ref=No] | -0.045 | -2.473 | 0.013 |
| Lateral Position Average | -0.102 | -10.042 | <0.001 |
| H Way Average | -0.001 | -12.249 | <0.001 |
On the other hand, the measure of the visuospatial working memory variable of EvalSpatialAddition (measured in meters) and the driver’s unjustified usage frequency of breaks (SuddenBrakes) were negatively correlated with reaction time. In other words, these parameters are correlated with a lower driver’s reaction time to an unexpected incident, possibly due to more alert and ‘on-edge’ behavior. LateralPositionAverage (vehicle’s distance from the central road axis, measured in meters) was found to be negatively correlated with drivers’ reaction time at an unexpected incident as well.
The developed log-linear model for the standard deviation of average speed is presented in Table 5 (statistically significant results with p-values lower than 0.05 are marked in bold):
In this analysis, driver age was found to be significantly negatively correlated with the standard deviation of the average speed that was achieved throughout the route while excluding the small sections in which incidents occurred and junction areas (Average Speed). In contrast, the variables EvalSpatialAddition (spatial addition test) and SuddenBrakes (how many times the driver suddenly used the brake unreasonably per trial) are positively correlated with the independent variable (StdevAverageSpeed). Interestingly, the 4th test question (Do you often get bored?) of the Geriatric Depression Scale questionnaire (yes/no answers) yields a positive correlation with the mean speed (in km/h) of the driver along the route, while for the 12th question (Do you feel pretty worthless the way you are now?) a negative correlation appears. As before, for EvalGDS_4 it can be seen that frequent ‘feelings of boredom’ have a statistically significant effect on the standard deviation of average speed increasing it by about exp(0.075) = 1.077, namely a 8% increase approximately. For EvalGDS_12, it is determined that ‘feelings of worthlessness’ were found to decrease the standard deviation of driving speed by about exp(-0.045) = 0.955, namely a 4.5% reduction.
As for the variable termed LateralPositionAverage, that denotes the distance of the vehicle in meters from the central road axis, indicating driving performance, this quantity was negatively correlated with driver average speed. Lastly, HWayAverage, indicating driving performance, was found to negatively influence the standard deviation of average speed recorded by participant drivers.
5.3. Mixed Log-linear Models
To capture the individual neurological disease (or no disease) of each driver, random effects were included in the data-oriented collection scheme. This entails having a critical minimum sample of neurologically impaired drivers to achieve a meaningful outcome. Therefore, 45 patients with Mild Cognitive Impairment, 28 patients with Alzheimer’s Disease, 25 patients with Parkinson’s Disease and 15 patients with depression (among 35 patients with other neurological diseases that lead to cognitive impairment) were selected for the mixed-model analysis.
The fixed effects of the developed mixed-effects log-linear model for reaction time is presented on Table 6 below (statistically significant results with p-values lower than 0.05 are marked with bold):
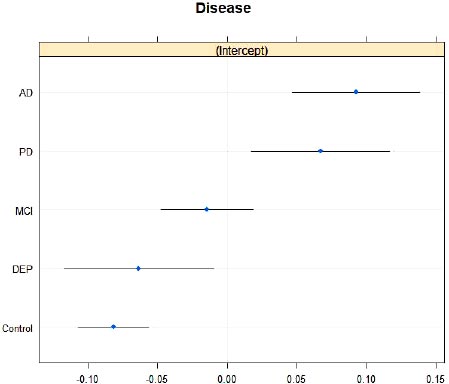
The modelling for ReactionTime confirms the apriori expectation that the coefficient signs and interpretation remains constant across the fixed and mixed-effect models. However, it is worth noting that a considerable margin of the variance inherent in the ReactionTime variable is now being explained by the random intercepts varying by disease group, causing the variable of EvalSpatialAddition to become statistically non-significant. The random intercept components of the model are presented visually on (Fig. 1) per disease category:
After a visual inspection of the random effects with the caterpillar plot, a series of conclusions were reached. Alzheimer’s and Parkinson’s Diseases appears to be positively correlated with a longer reaction time at an unexpected incident. Cognitive impairment caused by AD and PD appears to lead to slower braking on average when an incident on the road first appears. Conversely, drivers with depression or with no neurological disease (control group) appear to have less reaction time (i.e. quicker reflexes). Lastly, MCI does not have a correlation with the ReactionTime variable of participants.
The fixed effects of the developed mixed-effects log-linear model for reaction time is presented on Table 7 below (statistically significant results with p-values lower than 0.05 are marked with bold):
| Variable | Coefficient (β) | t-test Value | p-value |
|---|---|---|---|
| (Intercept) | 7.171 | 84.221 | <0.001 |
| Age | 0.004 | 4.414 | <0.001 |
| Sudden Brakes | -0.018 | -3.131 | 0.002 |
| EvalSpatialAddition | -0.004 | -1.561 | 0.119 |
| Eval GDS_4: Yes [Ref=No] | 0.075 | 2.770 | 0.006 |
| Eval GDS_13: Yes [Ref=No] | 0.032 | 1.330 | 0.184 |
| Lateral Position Average | -0.060 | -4.571 | <0.001 |
| H Way Average | 0.001 | 8.778 | <0.001 |
| Variable | Coefficient (β) | t-test Value | p-value |
|---|---|---|---|
| (Intercept) | 2.767 | 44.621 | <0.001 |
| Age | -0.002 | -3.711 | <0.001 |
| Sudden Brakes | 0.056 | 12.237 | <0.001 |
| EvalSpatialAddition | 0.003 | 1.617 | 0.106 |
| Eval GDS_4: Yes [Ref=No] | 0.076 | 3.634 | 0.000 |
| Eval GDS_12: Yes [Ref=No] | -0.037 | -1.995 | 0.046 |
| Lateral Position Average | -0.101 | -9.923 | <0.001 |
| H Way Average | -0.001 | -12.028 | <0.001 |
As in the previous analysis, the modelling for StdevAverageSpeed confirms the apriori expectation that the coefficient signs and interpretation remain constant across the fixed and mixed-effect models. However, it is worth noting that a considerable margin of the variance inherent in the StdevAverageSpeed variable is now being explained by the random intercepts varying by disease group, causing the variable of EvalSpatialAddition to become statistically non-significant. It is very interesting to note that the variable that was demoted to non-significance is the same across both the analyses. The random intercept components of the model are presented visually in Fig. (2) per disease category.
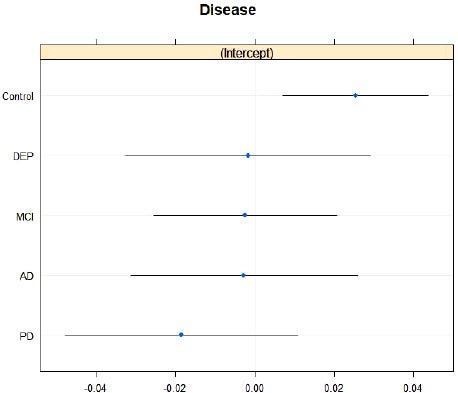
While examining a different set of dependent and independent (StdevAverageSpeed) variables, different outcomes arose. In this case, drivers without neurological diseases and unimpaired cognition showed a positively significant correlation with the StdevAverageSpeed variable [referring to the mean speed (in km/h) of the driver on the road, when small sections in which incidents may happen and junction areas are excluded]. Parkinson’s disease, on the other hand, marked a negative correlation with the mean driving speed along the road. Conversely, depression, MCI, and AD were not associated with significant differences in mean driving speed.
CONCLUSION
The present research aimed to explore the influence of a spectrum of neurological diseases that affect cognition on driving performance and behavior as expressed by reaction time and deviation of driving speed. In order to model the examined relationships, 133 cognitively impaired participants, suffering from various neurological diseases (MCI, PD, AD, and depression), and 92 people with no cognitive impairment (serving as the control group), constituted the sample of this study (original n=225, dropping to 205 after removing participants with miscellaneous diseases). The collected data were analyzed through log-linear fixed regression models and mixed regression models with the form of random intercepts per disease group.
Results indicated that the drivers’ reaction time to an unexpected incident was positively correlated with their age and the average headway they allowed from the previous car. Furthermore, positive answers to two psychological aspect questions [“Do you often get bored?” (4th question) and “Do you feel full of energy?” (13th question)] were also positively correlated with increased reaction time. Possible explanations lie in the fact that bored drivers are more indolent, while drivers that are full of energy might struggle more with retaining their focus. Conversely, reaction times were negatively correlated with the number of sudden brakes drivers perform, their visuospatial working memory (as measured by the Wechsler Memory scale-fourth edition test), and the vehicle’s distance from the central road axis, measured in meters.
When introducing random intercept modelling, the coefficients remained the same, with one exception, that is, a larger amount of reaction time variance was explained by the random intercepts varying by disease group, causing the variable of visuospatial working memory to lose its statistical significance. Specific additional results indicate that drivers with AD and PD had significantly higher reaction times, while drivers with depression and the control group had significantly lower reaction times, and drivers with MCI did not differ significantly from the average.
Regarding the standard deviation of driving speed, results indicate that higher sudden brakes and visuospatial working memory were correlated with increases in the dependent variable. On the other hand, driver age, lateral position, and average headway were correlated with a lower standard deviation of driving speed. Furthermore, positive answers to the psychological question “Do you often get bored?” (4th question) were positively correlated with standard deviation of driving speed, while positive answers to the psychological question “Do you feel pretty worthless the way you are now?” (12th question) were negatively correlated with the standard deviation of driving speed.
When introducing random intercept modelling, the variable of visuospatial working memory lost its statistical significance once again. However, the effect of the diseases was different; the control group of participants featured a positive statistically significant correlation with the standard deviation of driving speed, while PD drivers had statistically fewer deviations of average speed. Lastly, depression, MCI, and AD were not associated with significant differences in mean driving speed.
Since the present study was undertaken through the use of a simulator, various limitations arose. Indicatively, even simulated crashes may affect subsequent driving behavior and may have an unknown psychological impact and real-world conditions cannot be fully replicated or recreated, while also the drivers may not inherently believe in the capability of the stimulator to represent real driving conditions. Regardless, from the present study, fruitful observations can be drawn. Specifically, if a driving licensing authority includes psychological measurements regarding boredom and self-worth in driving license testing, a more representative picture of the driver sample, their reaction times, and their speed choices can be drawn.
All in all, the present research shows that cognitively impaired individuals have larger reaction times and more erratic driving speeds. While the models developed in the present study provide valuable insights into driving with neurologically impaired cognitions, further research is needed, especially on the impacts of depression on driving. A very promising direction for future research would be the investigation of how the stages and the symptoms of depression may lead to poor driving skills and an overall risky driving behavior. Present findings can be used to inform both patients and authorities of potential deviations in their driving behavior and can be taken into account when (re)issuing driving licenses. The impacts of various medications should be taken into consideration in such research as well. From this research, driving strategies for the safety of a driver with depression could arise and driving errors could be minimized.
LIST OF ABBREVIATIONS
| GDS | = Geriatric Depression Scale |
| ADRC | = Alzheimer’s Disease Research Center |
| PD | = Parkinson’s Disease |
| MCI | = Mild Cognitive Impairment |
CONSENT FOR PUBLICATION
Not applicable.
AVAILABILITY OF DATA AND MATERIALS
The data description supporting the findings of the article is available in the Greek National Archive of PhD. Theses at URL https://www.didaktorika.gr/eadd/handle/10442/43427, reference number 43427.
FUNDING
None.
CONFLICT OF INTEREST
Apostolos Ziakopoulos is the Co-EIC of journal The Open Transportation Journal.
ACKNOWLEDGEMENTS
Declared none.

