All published articles of this journal are available on ScienceDirect.

Strategic Utilization of Microsimulation for Sustainable Traffic Analysis and Intersection Improvement
Authors Info & Affiliations
Abstract
Background:
Traffic congestion is a worldwide challenge that poses significant economic, social, and environmental impacts. Countries worldwide, especially in urban areas, are confronted with the pressing challenge of managing traffic congestion.
Methods:
Traffic simulation can help create a model of the current situation of the state of the traffic and subsequently, simulate alternatives based on the current demand. To address this problem, this study aims to assess the traffic flow at a critical four-legged intersection (Sector G/11) in Islamabad, Pakistan, as a case study. It proposes a solution to alleviate traffic congestion using microsimulations. By utilizing software as a tool, we have created a model of the current state of the intersection, and, subsequently, proposed changes to the intersection's geometric features by designing an optimal solution for it.
Results:
The resulting modifications led to improved traffic flow, and reduced emissions and fuel consumption by 47%, minimized delays to 40%, resulting in an overall enhancement of the Level of Service from ‘E’ to ‘B’.
Conclusion:
Overall, this study demonstrates the potential benefits of using microsimulations in traffic management and underscores the need for innovative and sustainable solutions to address the complex issue of traffic congestion. The novelty of this paper lies in its pioneering approach of employing microsimulation techniques to analyze the intricacies of traffic conditions within a country like Pakistan, characterized by a multitude of factors contributing to congestion.
1. INTRODUCTION
Road traffic is like a pandemic, and it has been increasing rapidly with time, and road networks to cater to such a huge amount of traffic are not enough [1]. So, an optimal and efficient solution is needed so that with a few modifications in the current network of roads, we can manage the traffic to make them move uninterrupted. Traffic congestion can also cause many road traffic injuries and fatalities which are a cause of concern in the world [2].
Congestion can significantly increase travel time, leading to inconvenience for drivers, passengers, and public transportation users [3]. When vehicles are stuck in traffic, they consume more fuel and emit more pollutants, which are both expensive and harmful to the environment. Sitting in traffic for long periods can be frustrating and stressful, which can negatively impact mental health and well-being. It also leads to delayed arrivals and missed appointments, which can reduce productivity and cause inconvenience. Congestion increases the risk of accidents as drivers may become more aggressive or make risky maneuvers to get out of traffic, especially for vulnerable road users [4]. Congestion can slow down emergency services, such as ambulances and fire trucks, which can have serious consequences for public safety. Traffic congestion can also result in increased noise pollution, which can be a nuisance for nearby residents and negatively impact health.
Pedestrian safety remains a significant challenge in countries such as Pakistan, where adherence to traffic regulations is often lax. Within our selected area, the presence of multiple pedestrian bridges is intended to facilitate safe pedestrian crossings. However, a noteworthy observation is that a substantial portion of pedestrians opt to traverse the road amidst moving traffic, thereby impeding the flow of vehicles. This behaviour is primarily attributed to the congestion of traffic, rendering conventional pedestrian crossings less appealing due to the sluggish pace of vehicles. Consequently, pedestrians often perceive such crossings as less time-efficient and, in turn, feel less apprehensive about resorting to road-level crossings.In conclusion, it can be inferred that factors contributing to an elevated risk of pedestrian fatalities in accidents involving pedestrians and motor vehicles encompass elements such as instances of impaired driving due to violation of traffic laws and the pedestrian’s violation of road ethics and rules [5].
Pakistan, as a developing country, also faces these issues, especially in its major metropolitan cities [6]. The road network present is not efficient in dealing with ever-increasing traffic demand [7]. The lack of public transportation options in many cities also leads to an increase in private vehicles on the road, exacerbating traffic issues [8]. Another aspect is the lack of serviceability of pedestrian bridges or underpasses, which results in a high number of injuries related to road traffic [9]. Because cities are growing quickly, more and more people are leaving the suburbs and moving to the cities for jobs, a better way of life, and improved services. This has led to a big increase in traffic since these newcomers use cars to get around, causing more congestion on the roads. To address this issue, various studies explore ways to make traffic better and examine the environmental and financial benefits using microsimulations in different scenarios [10].
Traffic congestion can cause a range of issues related to inconvenience and safety, which highlights the need for effective transportation planning and management to mitigate these problems.
Traffic congestion can have a significant impact on fuel consumption. When vehicles are stuck in traffic, they tend to idle and consume more fuel, which leads to increased emissions and a higher carbon footprint [11]. The occurrence of stop-and-go patterns, particularly in multilane, leads to the substantial emission of harmful gases and notably elevated fuel consumption, far surpassing what would be expected under conditions of steady traffic flow [12]. Furthermore, slow-moving or stopped vehicles use more fuel to get back up to speed compared to vehicles that can maintain a steady pace. The frequent starts and stops also put additional strain on the engine and lead to reduced fuel efficiency [13]. In addition, traffic congestion can increase travel time, leading to longer trips and more fuel consumption. This is especially true for commercial vehicles such as trucks, which are often on the road for longer periods and consume more fuel [14].
Overall, traffic congestion leads to increased fuel consumption and emissions, which can have negative impacts on the environment and contribute to climate change [15]. Addressing these traffic issues through measures such as improving the road infrastructure, reducing vehicle idling, and promoting public transportation can help reduce fuel consumption and lower emissions [16].
Traffic congestion can also increase the risk of accidents on the roads [17]. This is because drivers may become frustrated, impatient, and aggressive, which can lead to risky driving behavior such as speeding, overtaking in unsafe areas, and ignoring traffic signals [18]. In the case of an emergency, such as a car accident or medical emergency, traffic congestion can make it difficult for emergency services to respond quickly. Ambulances, fire trucks, and police cars may struggle to get to the scene of an accident promptly, which can result in serious injuries or fatalities [19]. Traffic congestion can also lead to poor air quality in Pakistan, which can have significant health impacts [20]. Breathing in polluted air can increase the risk of respiratory problems, heart disease, and other health issues [21]. Pedestrians are particularly vulnerable to the risks of traffic congestion [22]. In many cases, they may be forced to walk in the middle of the road or cross busy streets, which can increase the risk of accidents. Traffic congestion puts a strain on the infrastructure of Pakistan, including the roads and bridges [23]. This can lead to the deterioration ion of the road surface, making it more difficult for drivers to maintain control of their vehicles, increasing the likelihood of accidents [24].
This research will help to evaluate and elevate future designs and road networks for better and efficient traffic flow for safety, efficiency, and smooth traffic flow. To address these issues, the government has implemented measures such as improving the road infrastructure, increasing the enforcement of traffic laws, and promoting public transportation. However, progress has been slow and much more needs to be done to address the ongoing traffic problems in the country [25]. Here as Engineers, our role needs to be played so that we can design and suggest a solution for the safe, rapid, and efficient traffic flow.
PTV VISSIM is a computer simulation software that provides traffic planners and engineers with a virtual environment to study and analyze traffic conditions [26]. The software creates a 3D representation of roads and intersections, allowing users to evaluate different traffic scenarios and predict their effects on traffic flow and congestion [22]. It is equipped with advanced features for modeling and simulating a wide range of transportation systems, including private vehicles, public transportation, and pedestrian and bicycle traffic [27].
With PTV VISSIM, transportation professionals can analyze different variables such as traffic signal timings, road design, and vehicle behavior to optimize traffic flow and minimize congestion. The results of these simulations can provide valuable insights into the best practices for traffic management and support informed decision-making [28]. PTV VISSIM is widely used in cities and regions across the world to improve transportation efficiency and reduce negative impacts on the environment, such as air pollution and fuel consumption.
After gathering traffic data during peak hours, we utilized the VISSIM software to simulate the conditions and evaluate the results. Based on our findings, we designed and proposed solutions for the identified issues.
2. METHODOLOGY
This section presents the adopted methodology of the current study. It presents the characteristics of the site under study. The data collection parameters and data collection strategy.
2.1. Site Characteristics
A four-legged Intersection on Srinagar Highway at G/11 Islamabad, Pakistan, experiences heavy traffic during the afternoons, leading to congestion, particularly in one direction, which is a problem. That is why we this intersection was chosen for our case study and an optimal solution was proposed to eradicate the congestion at this intersection.
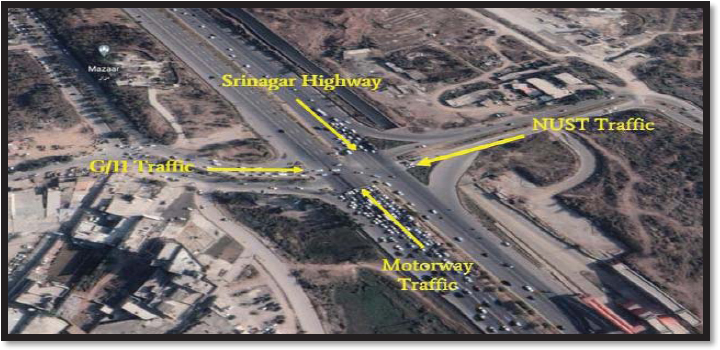
At the G/11 Intersection, a 3-lane road coming from G/11 connects to the Srinagar Highway and opposite to it, another 3-lane road coming from the National University of Science and Technology (NUST) has limited traffic flow as only the university students or staff vehicles join the Srinagar Highway. In contrast, the main traffic is on the 5-lane Srinagar highway itself, on which both sides traffic is coming and going towards the Motorway. The traffic joining the Srinagar Highway from left and right joining roads interrupts the main traffic on the highway. It is a “4-Legged Intersection”. The highway traffic halted for 60 to 90 seconds to allow a relatively smaller two-road network to cross over the intersection. This not only resulted in long queues developing on the Highway, but during off-peak times the Highway was stopped when there appeared to be no traffic present at G/11 or NUST roads linking to the intersection. A satellite image showing the proper directions of each road is shown in Fig. (1). A significant portion of the traffic volume originates from the Srinagar Highway. It converges onto the Motorway, warranting particular focus and prioritization to ensure the seamless and uninterrupted flow of traffic. This strategic attention serves to mitigate factors such as fuel emissions and vehicular delays, ultimately enhancing the Level of Service.
2.2. Data Collection
For our simulation, we have evaluated the Level of Service (A to F) and Vehicular Delays which play a vital role in traffic congestion. For getting their values we need to incorporate some of the parameters in microsimulation Software to get data for evaluation. Following are some of the parameters that are required for creating a simulation:
(1) Number of lanes in each direction,
(2) The width of each lane, the direction of traffic flow,
(3) The total number of vehicles in each direction,
(4) Vehicular composition in every direction,
(5) Allowed speed limits for LTV and HTV
(6) The identification of low-speed high-speed zones.
2.3. Data Collection Strategy
There are several methods for traffic counting like counting through a logbook, Jamar Counter, or counting through a recorded video. The method of counting through a recorded video was selected for our research where a camera was set up at an angle that all the vehicles entering and leaving at this intersection would be visible. The data was collected from the video using a logbook.
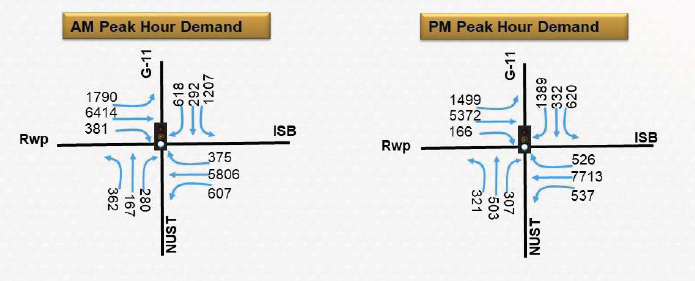
Two independent observers extracted the data from each video to ensure the validity of the dataset. Details of the maximum number of counted vehicles in each direction of the Intersection are shown in Fig. (2): In each direction three way traffic is moving, one is continuing in the direction of the road, one towards left and one towards right. Data from peak AM hour and Peak PM hour is shown so that it will be easier to design the maximum traffic flow either in AM or PM peak hour time of traffic flow.
2.4. Findings
2.4.1. Creation of Intersection Model
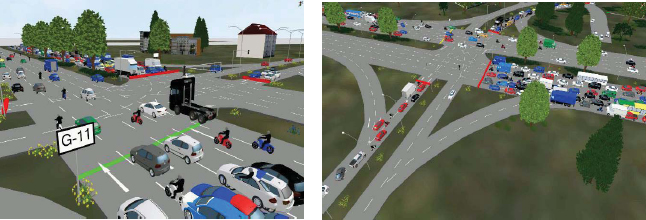
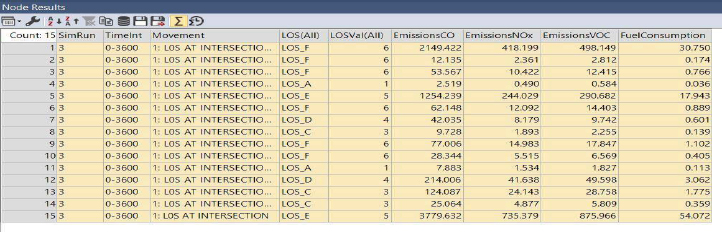
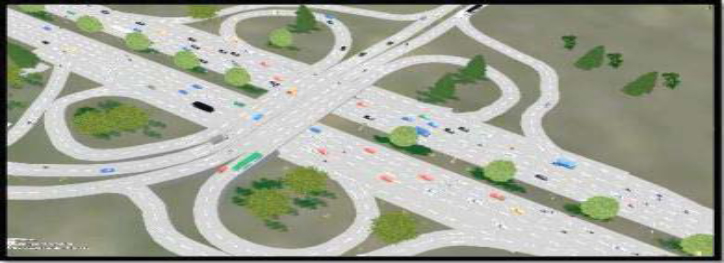
Simulation with current traffic input and parameters is created in microsimulation software, and the results after evaluating the simulation are given in Table 1. The factors that we evaluated in our proposed solution are the Level of Service (LoS) and vehicular delays. Also, the snapshots of the simulation of the current condition are shown in Fig. (3), showing congestion at all major legs of the intersection.
| S.No. | The direction of Traffic Flow | Level of Service (LOS) | Vehicular Delays (sec) |
|---|---|---|---|
| 1. | Srinagar Highway to Motorway (Towards North) | F | 128.28 |
| 2. | Motorway to Srinagar Highway (Towards the South) | F | 182.64 |
| 3. | Srinagar Highway to Sector G/11 (Towards North-East) | D | 100.83 |
| 4. | Sector G/11 to Srinagar Highway (Towards South-East) | D | 3.93 |
| 5. | Srinagar Highway to NUST (Towards the West) | C | 2.64 |
| 6. | NUST to Srinagar Highway (Towards North-West) | C | 4.97 |
| 7. | Sector G/11 to NUST (From East to West) | E | 70.91 |
| 8. | NUST to Sector G/11 (From West to East) | C | 46.28 |
| 9. | Sector G/11 to Motorway (Towards East-Northern) | D | 73.21 |
| 10. | Motorway to NUST (Towards the West) | E | 74.16 |
| 11. | Srinagar Highway to Sector G/11 (Towards East) | F | 121.34 |
| 12. | NUST to Srinagar Highway (Towards North) | E | 43.55 |
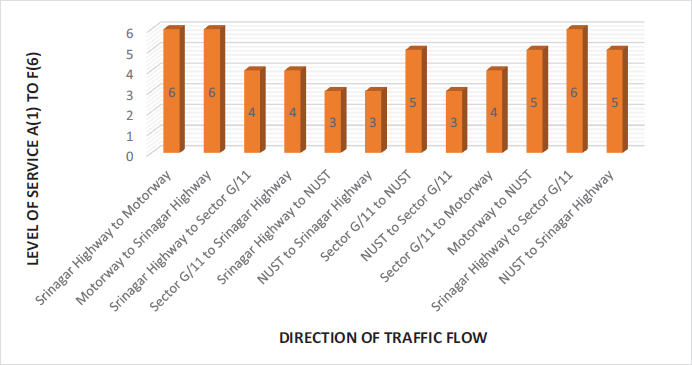
Here is the Bar graph in Fig. (3), which shows the level of service of all the routes of the traffic flow. The bar graph illustrates a Level of Service scale extending from 1 to 6, where 1 denotes the highest level (Level of Service A), and 6 represents the lowest, signifying Level of Service F.
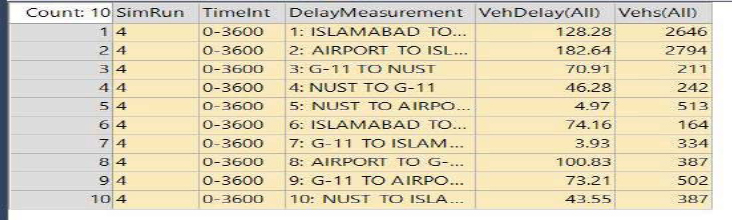
Fig. (4) provides a comprehensive depiction of the traffic dynamics at the point when the signal transitions to red, resulting in congestion. This, in turn, leads to vehicular delays, increased fuel emissions, and subsequent degradation of the Level of Service.
Fig. (5) shows the snapshot of the data, that is, the node results obtained from the created simulation.
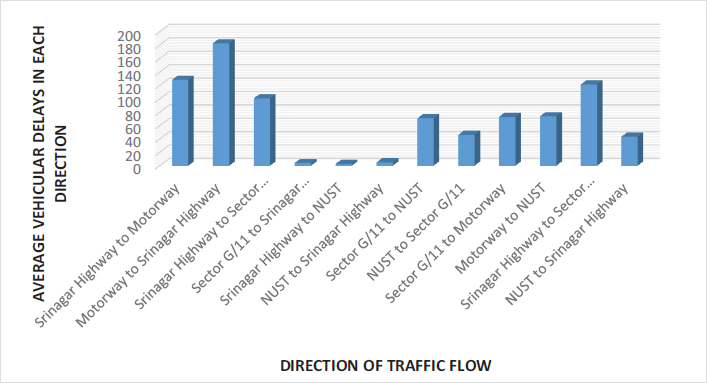
Similarly, results for vehicular delays after evaluating the simulation of the current condition. Below bar graph below for Vehicular delays in each direction is shown in Figs. (6 and 7), which needs to be improved significantly for the traffic flow to improve and to reduce congestion.
3. RESULTS
Numerous countries are actively seeking solutions to enhance traffic safety and capacity within their existing roundabouts, contemplating effective measures to address these challenges [12]. After careful analysis, the issue of traffic congestion at the intersection is resolved by modifying the geometric features, i.e., providing the Clover Leafed Standard Flyover at the intersection (Fig. 8). Cloverleaf flyover employs a grade separation technique to let vehicles from one or more roads pass the intersection without having to cross it or obstruct the other traffic flows physically. Since there is no need to slow down, traffic moves at a brisk pace.
3.1. Design of Proposed Solution
For the design of the standard clover leaf flyover, in each quadrant, there is one loop ramp for traffic going to the right and one outside connector for traffic turning to the left. A 270-degree turn to the left is necessary for vehicles wanting to turn right before they may proceed in the preferred direct case [29].
In our case, a standard clover leaf flyover would bypass the traffic coming from Sector G/11 over the flyover to NUST and vice versa, as shown in Fig. (8). Slip lanes are also provided to merge any traffic onto the highway.
4. DISCUSSION
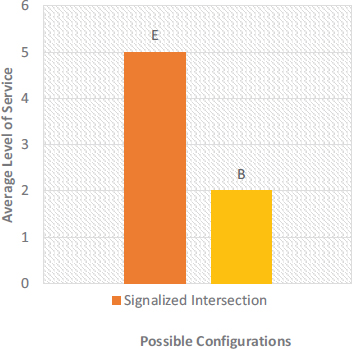
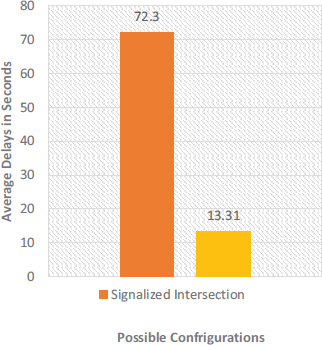
With the assistance of microsimulation software-based simulations, it becomes possible for us to effectively compare both scenarios of the current condition i.e., signalized intersection, and the proposed solution i.e., standard clover leaf flyover. Our main focus is on the increasing level of service of the intersection which ultimately decreases vehicular delays. By running the actual traffic data of the signalized intersection collected by us in the microsimulation, we get the LoS E (30-45 veh/mile/lane), and on this LoS, the vehicular delay comes out to 72.3 sec. It is to be clear that these delays are the average delays each car is facing in each configuration. Similarly, when we simulated the clover leaf flyover, the results were remarkable. The LoS, which was E, increased to B (6-10 veh/mile/lane), and the delays were reduced to 13.31 sec.
Figs. (9 and 10) shows the comparison of LoS and vehicular delays between the two evaluated conditions i.e., signalized intersection and clover leaf flyover. Moreover, this alone is not solely the advantage of the proposed solution. As fuel consumption is directly related to delays, reduction in delays has had a substantial effect on minimizing fuel waste, operating costs, and exhaust pollutants [29]. Therefore, we can say that after reducing the delays at the intersection we can also save fuel consumption and reduce environmental pollution.
4.1. Software Limitations
Although microsimulation software enhances the functionality of traffic infrastructure by simulating connected and autonomous automobiles, showing their specific motion patterns, and simulating interactions with other vehicles, some limitations have to be taken into account while modeling.
Microsimulation software has limitations in terms of its applicability for calibration in other countries, primarily due to its origin as a software developed by a German company and its reliance on local data and calibration. Differences in traffic laws, traffic control devices, and road design between countries can also impact the accuracy of simulation results. Additionally, limitations exist regarding transportation policies designed to diminish vehicle emissions. Microsimulation software relies on accurate data on fuel consumption and vehicle emissions, which may prove challenging to obtain under real-world circumstances. Furthermore, it may not be able to fully capture the impacts of emerging vehicle technologies and alternative fuels. As the transportation sector continues to evolve, new vehicle technologies and fuels may be introduced that are not well represented in microsimulation software. This could limit the ability of the software to accurately simulate the impact of these changes on traffic flow, emissions, and other factors.
These limitations must be carefully considered and addressed to ensure that simulation results accurately reflect real-world conditions.
CONCLUSION
Presently, traffic modeling and simulation are frequently used tools in the design of road infrastructure. Considering this, microsimulation software is used to improve the issue of traffic congestion. Microsimulation software is a sophisticated transportation simulation software tool that enables transportation professionals to model and analyze traffic flow, evaluate alternative transportation solutions, and optimize traffic signals and other traffic control devices.
Across many parts of the world, developed or not, traffic congestion has been on the rise, and all signs point to it only becoming worse in the future. This poses an undeniable threat to the quality of urban life and the safety of its citizens. The process manifests as a gradual slowing down of speeds, which results in increasing travel times and an increase in environmental pollutants and fuel consumption as compared to an uninterrupted traffic flow. The extensive usage of vehicles is the major cause of traffic. Particularly in developing nations e.g., Pakistan, private vehicles provide benefits in terms of enabling personal movement as well as conveying feelings of protection and even elevated status. However, they are ineffective for moving people about as compared to public transportation [30]. At the same time, the existing road network has not kept pace with this growth, leading to overcrowded roads and intersections. Outdated road design and a lack of traffic management systems also contribute to traffic congestion in Pakistan.
This paper evaluates the traffic flow at the four-legged intersection (Sector G/11) in Islamabad as a case study and suggests a design that will reduce the intersection's traffic congestion. The selected congested intersection's traffic was initially simulated for the present situation. Then modifying the geometric features of the intersection, a clover leaf flyover is suggested to mitigate the traffic congestion problem. This modification significantly reduces traffic congestion by improving the level of service at the intersection to B (6-10 vehicles/mile/lane). Also, a serious decrease in vehicular delays is observed i.e., from a 72.3-sec delay to a 13.31-sec delay. In this study, only vehicular delays and LOS were considered to reduce traffic congestion and improve the condition of the intersection. Furthermore, to determine the best possible solution, it's crucial to evaluate multiple aspects like cost, safety, etc.
Our research encountered certain limitations that merit discussion. Notably, these limitations stem from the divergence between the vehicle types commonly found in countries like Pakistan and their representation within microsimulation software. The software, unfortunately, does not encompass the full spectrum of vehicle models and types that exist in this region. Furthermore, an additional challenge arises from the lack of rigorous vehicular emissions standards enforcement and inspection protocols, contributing to deviations between simulated outcomes and real-world scenarios. Moreover, the wide array of vehicle models in circulation, ranging from older models dating back to the early 90s to contemporary ones, introduces variability that may marginally affect data accuracy.
FUTURE RESEARCH RECOMMENDATIONS
The door is open for a more in-depth study of the intersection incorporating other aspects e.g., fuel consumption, impact on the environment, etc., using microsimulation software for the issue of traffic congestion. Also, this same model can be implemented on various road networks having similar traffic conditions with little modifications.
LIST OF ABBREVIATIONS
| LoS | = Level of Service |
| NUST | = National University of Science and Technology |
CONSENT FOR PUBLICATION
Not applicable.
AVAILABILITY OF DATA AND MATERIALS
The data and supportive information are available within the article.
FUNDING
None.
CONFLICT OF INTEREST
The authors declare no conflict of interest, financial or otherwise.
ACKNOWLEDGEMENTS
Declared none.

