All published articles of this journal are available on ScienceDirect.

Dynamic Panel Data Analysis of Road Capacity and Traffic Demand: Evidence from the Rawalpindi Division, Pakistan
Abstract
Introduction
This study estimates traffic demand response to road capacity changes in Rawalpindi Division, Pakistan, using panel data on Vehicle-Kilometers Traveled (VKT) and lane-kilometers. It provides subnational evidence from a South Asian context where link-level panel data are rarely available.
Methods
A dynamic panel dataset comprising 69 road segments observed over nine years (2014–2023) was analyzed. Arellano–Bond and Blundell–Bond System GMM estimators were applied to address potential endogeneity, unobserved link heterogeneity, and the dynamic adjustment in traffic demand. All continuous variables (VKT, lane-kilometers, fuel price, vehicle ownership, and population growth rate) were log-transformed to estimate elasticities and stabilize variance.
Results
The preferred System GMM yields an elasticity of 0.967 for lane-kilometers, implying that a 1% increase in lane-kilometers is associated with an approximately 1% increase in VKT. Fuel price, vehicle ownership, and population growth rate are statistically insignificant in the preferred model. Diagnostic tests support instrument validity and indicate no evidence of second-order serial correlation in differenced residuals.
Discussion
The near-unit elasticity is consistent with induced-demand mechanisms, suggesting that capacity expansions are associated with higher traffic volumes and erode congestion relief. The weak effects of fuel prices and vehicle ownership reflect Pakistan’s institutional and behavioral context, including regulated fuel prices and a vehicle fleet dominated by motorcycles, along with limited modal alternatives.
Conclusion
Road capacity expansion in Rawalpindi Division is strongly associated with higher traffic volumes. Supply-only strategies are therefore likely to deliver limited long-run congestion relief unless accompanied by multimodal mobility measures and demand-management policies.
1. INTRODUCTION
Traffic in cities is closely associated with urbanization and population expansion [1]. Globally, urban traffic congestion is a major challenge, characterized by slower speeds, longer travel times, and increased vehicle queuing [2]. In response, road network capacity is often expanded or improved to address this issue [3-5]. This remains a common policy response to congestion in many countries [6-8]. Although added capacity can reduce travel time in the short run, it is often followed by increased traffic volumes that erode anticipated congestion relief [9]. Improved accessibility lowers generalized travel costs and can encourage additional travel through changes in trip frequency, route choice, and mode choice [10-13].
This demand response to capacity change is widely discussed in the induced-demand literature [14-16]. In this paper, we estimated the aggregate traffic demand response by modeling the elasticity of VKT with respect to lane-kilometers. For transport policymakers, quantifying this elasticity is essential because it indicates how far road expansion translates into additional traffic and, consequently, how durable congestion benefits are likely to be.
The empirical setting is Rawalpindi Division, Punjab, Pakistan, a region with a mix of urban and semi-urban corridors and evolving travel patterns [17]. The division covers an area of 22,254 km2 and has a population of approximately 11 million [18].
Over the past decade, Rawalpindi has experienced sustained investment in road infrastructure to accommodate growth in mobility needs [19]. However, link-level evidence on how traffic volumes adjust following capacity changes remains limited for Pakistan. This gap is important because transport growth contributes to congestion, air pollution, crashes, noise, and greenhouse gas emissions, intensifying negative externalities as the vehicle fleet expands.
To address this gap, we constructed a road-link panel dataset for 2014-2023 and applied dynamic panel estimators (Arellano–Bond and Blundell–Bond System GMM). These methods are well-suited to settings where traffic demand is persistent and where capacity and traffic may be jointly determined. The analysis provides policy-relevant elasticity estimates while accounting for unobserved link characteristics and potential endogeneity.
This paper contributes to the literature in three ways. First, it provides one of the first dynamic panel estimates of traffic demand response to capacity change for a South Asian setting using link-level data. Second, it jointly considers supply-side capacity (lane-kilometers) and key demand-side controls (vehicle ownership, fuel prices, and population growth rate). Third, it offers implications for investment appraisal and demand management in rapidly growing regions where road expansion remains a dominant intervention.
Finally, we measured travel demand using aggregate VKT. Because VKT captures both newly generated travel and redistributed traffic (e.g., route shifts), our elasticity estimates should be interpreted as overall traffic demand responses to capacity change, rather than the narrower “new-trip-only” induced-demand concept used in some appraisal guidelines.
2. REVIEW OF LITERATURE
The concept of induced demand is rooted in the economic theory of supply and demand. When road capacity expands, the generalized cost of travel decreases, primarily due to reduced congestion and travel time, which incentivizes additional travel behavior [20-25]. Induced demand includes new trips, route shifts, mode shifts, and even changes in land use, as people respond to improved accessibility [26, 27]. These behavioral responses manifest in both the short and long-term. In the short term, changes include route switches, mode changes, and increased trip frequency, while in the long term, they extend to land-use shifts and increased vehicle ownership [28-30].
To avoid definitional ambiguity, we used the term traffic demand response for our empirical object-aggregate VKT elasticity with respect to lane-kilometers-and referred to induced demand when discussing the broader literature and mechanisms.
The relationship between road expansion and induced traffic has been extensively studied in developed countries. Duranton and Turner [9], through their seminal work on the “fundamental law of road congestion,” demonstrated a nearly one-to-one elasticity of VKT with respect to road capacity in the United States. Similarly, Hymel [31] confirmed that lane-mile increases in urban roads lead to proportional or even greater increases in VKT.
Studies in European contexts also corroborate these findings. González and Marrero [32] analyzed induced demand in Spanish regions using a Dynamic Panel Data (DPD) model, finding elasticity values between 0.27 and 0.31 for lane-kilometer increases. Their work highlighted the importance of dynamic modelling to account for behavioral inertia and long-term adjustments. Bucsky and Juhász [33] examined traffic on Budapest bridges over 55 years, providing rare long-term evidence of induced traffic in an urban European setting. They demonstrated that increased capacity consistently led to higher traffic volumes, even as the city transitioned from a socialist to a market economy.
While developed country studies often focus on urban and intercity highways, they underline the need for robust planning frameworks to manage traffic growth and avoid congestion rebound effects. For instance, studies on U.S. highways have shown that induced traffic can offset congestion reduction benefits within a few years of project completion [34, 35]. Induced traffic dynamics in developing countries are shaped by rapid urbanization, growing populations, and infrastructure deficits. Studies in these contexts reveal distinct challenges due to high latent demand and informal transportation networks. Studies have shown that ignoring induced demand can result in unsustainable urban sprawl, increased greenhouse gas emissions, and diminished returns on infrastructure investments [36]. Rahman et al. [37] investigated induced demand in Dhaka, Bangladesh, using flyovers as a case study. Their findings indicated that flyovers increased trip frequency and travel distances, driven by travel time savings and improved accessibility. This study highlighted the critical role of induced demand in urban infrastructure planning in rapidly growing cities. In India, Ponnu et al. [38] assessed the economic feasibility of highway projects, showing that failure to account for induced traffic leads to inflated benefit-cost projections. Their work emphasized the importance of using travel-cost elasticity rather than static lane-kilometer elasticity to better capture the dynamic effects of road improvements. Similarly, Chen and Klaiber [39] examined road expansions in 103 Chinese cities and found that new roads led to proportional increases in VKT, consistent with findings from developed countries. Their use of a novel matching Instrumental Variable (IV) strategy provided robust evidence of induced traffic, particularly in rapidly urbanizing areas. Early studies often relied on aggregate data and simple elasticity measures, limiting their ability to capture complex behavioral responses. More recent research employs DPD, Instrumental Variable (IV) techniques, and aggregate data to improve causal inference and measurement accuracy [30, 40]. For instance, González and Marrero [32] applied DPD models to control for endogeneity and temporal dynamics, revealing nuanced elasticity estimates for short- and long-term effects. Elasticity, a measure of the responsiveness of one variable to changes in another, provides valuable insights into the factors driving travel demand [41-45]. The elasticity of VKT with respect to lane-kilometers indicates the extent to which road capacity influences travel patterns [46]. Similarly, factors such as vehicle ownership, demographic conditions, and travel costs help explain the socioeconomic and cost influences on mobility decisions [47, 48]. Table 1 provides a detailed overview of the studies addressing the relationship between traffic demand and changes in road supply through elasticity ratios. The behavioral mechanisms underlying traffic demand include latent demand, i.e., suppressed travel reactivated by new capacity, mode shifts from public transport, and long-term land-use feedback. However, most prior studies fail to model these dynamics explicitly, particularly in the context of rapidly urbanizing economies like Pakistan. The traffic demand response to capacity expansion in Pakistan is shaped by structural features that differ from many high-income settings. First, latent demand is likely to be high: congestion, unreliable travel times, and constrained road space suppress trip-making, and lane additions can quickly “release” previously suppressed trips. Second, the vehicle fleet is dominated numerically by motorcycles and other two-/three-wheelers, which can change trip frequency and trip length when travel times fall, even if their contribution to total vehicle-kilometers is smaller than that of cars and freight. Third, the urban transport system includes a large informal and semi-formal sector (e.g., paratransit and informal services) that interacts with road conditions; capacity expansions can shift routes, departure times, and mode choices toward road-based travel. Finally, land-use feedback may amplify longer-run effects: improved corridor speeds and reliability can support longer commutes and incremental decentralization, increasing vehicle-kilometers beyond the immediate corridor. These mechanisms motivate interpreting the estimated lane-kilometer coefficient as a demand elasticity of VKT that reflects overall changes in observed motorized travel (including new trips, diversion/rerouting, and longer trips) under Pakistan’s institutional and market context.
| Study | Method | Demand Measure | Supply Measure | Elasticity | Time Period (Years) | Country |
|---|---|---|---|---|---|---|
| Hsu & Zhang [34] | Econometric | vkt | lane km | 0.89 | 5 (various) | Japan |
| Van der Loop et al. [49] | Econometric, review | vkt | lane km | 0.2 | 15 (2000 to 2014) | Netherlands |
| Milam et al. [50] | Review | vmt | capacity increase | 0.4 to 1.03 | 31 (1973 to 2003) | USA |
| Rahman et al. [37] | Econometric | trips | travel time saving | 0.35 | 1 (2015) | Bangladesh |
| Bucsky and Juhász [33] | Econometric | adt | capacity increase | 0.5 | 55 (1965 to 2020) | Hungary |
3. DATA AND METHODOLOGY
This study utilizes a detailed panel dataset of 69 existing primary and secondary road links in the Rawalpindi Division. During 2014–2023, no new classified links were added to this panel; all observed changes in lane-kilometers reflect lane additions on these existing links, while some links retain constant capacity. The capacity variable, therefore, captures intensive-margin expansion on existing corridors, rather than greenfield road construction.
Data on traffic volumes, road characteristics and vehicle counts were obtained from the annual traffic summary books published by the Communication and Works Department (C&W), Government of Punjab, which provide consistent records over time. Traffic counts are reported as numbers of vehicles by class (cars, buses, trucks, motorcycles, etc.), but standardized PCU factors or axle-weight information are not consistently available for all links and years. For this reason, VKT were computed as the unweighted sum of vehicle-kilometers across all motorized vehicle classes, rather than as PCU- or axle-weighted traffic. This approach yields an elasticity for aggregate VKT and does not distinguish passenger from freight traffic in the regression.
Although the traffic count books report broad vehicle classes, the series are not fully consistent across years and links (e.g., changes in classification and missing sub-categories), so class-specific VKT cannot be reliably constructed. Exploratory models that included simple class shares as additional regressors yielded unstable and highly collinear estimates. We therefore focus on aggregate VKT in the econometric analysis and treat vehicle composition qualitatively in the discussion, explicitly noting this as a limitation.
Fuel price data were obtained from Pakistan State Oil (PSO), expressed as the nominal retail price of petrol in PKR per liter and averaged by year. Data on registered vehicles were taken from the Excise, Taxation and Narcotics Control Department, Government of the Punjab.
Population growth rate data were procured from the Pakistan Bureau of Statistics (PBS), which provides the most disaggregated and consistent official series for the study period. PBS reports these rates as the annual percentage change in district population, which are then log-transformed for estimation. District-level population and growth are the most disaggregated official measures consistently available for the study period; link- or corridor-level population served by each road segment is not recorded in administrative datasets, so district-level values are used as the best available proxy for the potential demand base. Key variables, therefore, include VKT, total lane-kilometers, vehicle ownership (number of registered vehicles), fuel price, and population growth rate, providing a robust basis for analysing traffic demand response to capacity expansion. The year 2020 was omitted because no official traffic count was conducted due to COVID-19–related disruptions. All statistical analyses were carried out in Stata MP 18, which offers advanced tools for dynamic panel estimation.
All continuous variables were transformed into natural logarithms to correct for skewness, reduce heteroscedasticity, and allow estimated coefficients to be interpreted as elasticities. This transformation enables the analysis to capture proportional, rather than absolute, changes, which is useful for policy interpretation. The dependent variable, log(VKT), represents annual vehicle-kilometers per road segment, aggregated from daily traffic counts reported by the C&W Department. Explanatory variables include log(lane-kilometers) (total motorized road lane length), log(fuel price) (PKR per liter), log(vehicle ownership) (number of registered vehicles), and log (population growth rate).
The estimation strategy employs the Arellano–Bond dynamic panel data model and its extension, the Blundell–Bond System GMM estimator, to address potential endogeneity arising from autocorrelation, measurement error and simultaneity between road capacity and traffic demand. Lagged levels and differences of the dependent variable are used as internal instruments. Specifically, lags from the second period onward (t–2 and deeper) are employed to minimise correlation with the idiosyncratic error term while avoiding instrument proliferation and overfitting. This specification follows established practice in dynamic panel estimation and enhances the reliability of the coefficient estimates.
To validate instrument consistency and the overall model specification, we apply the Arellano–Bond autocorrelation tests (AR(1) and AR(2)), the Sargan and Hansen tests of over-identifying restrictions, and, for System GMM, the Difference-in-Hansen test for the additional level-equation instruments. The results indicate no problematic second-order serial correlation and do not reject the over-identifying restrictions, suggesting that the chosen instruments are valid and uncorrelated with the error term and supporting the robustness of the estimation strategy. The spatial context of the study area, including district boundaries, major corridors, and land-use overlays, is illustrated in Fig. (1).
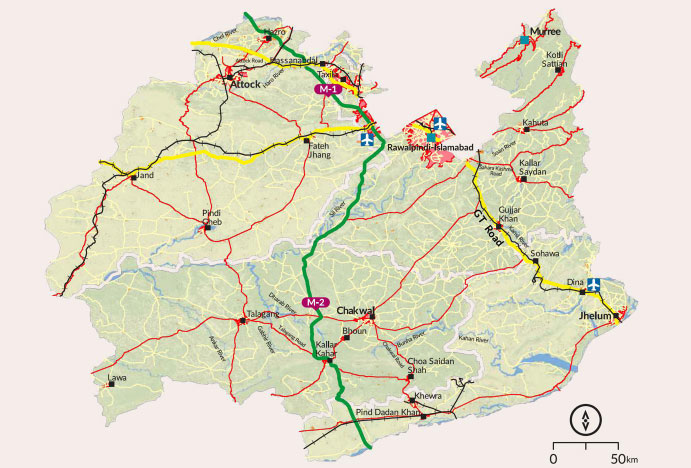
Map of Rawalpindi Division with overlays of roads, land use, and district boundaries.
3.1. Study Framework and Econometric Model
The overall analytical design of the study is summarized in Fig. (2), which links data construction, econometric specification, diagnostic testing, and policy interpretation. The subsequent subsections describe the dynamic panel model and estimation techniques in more detail.
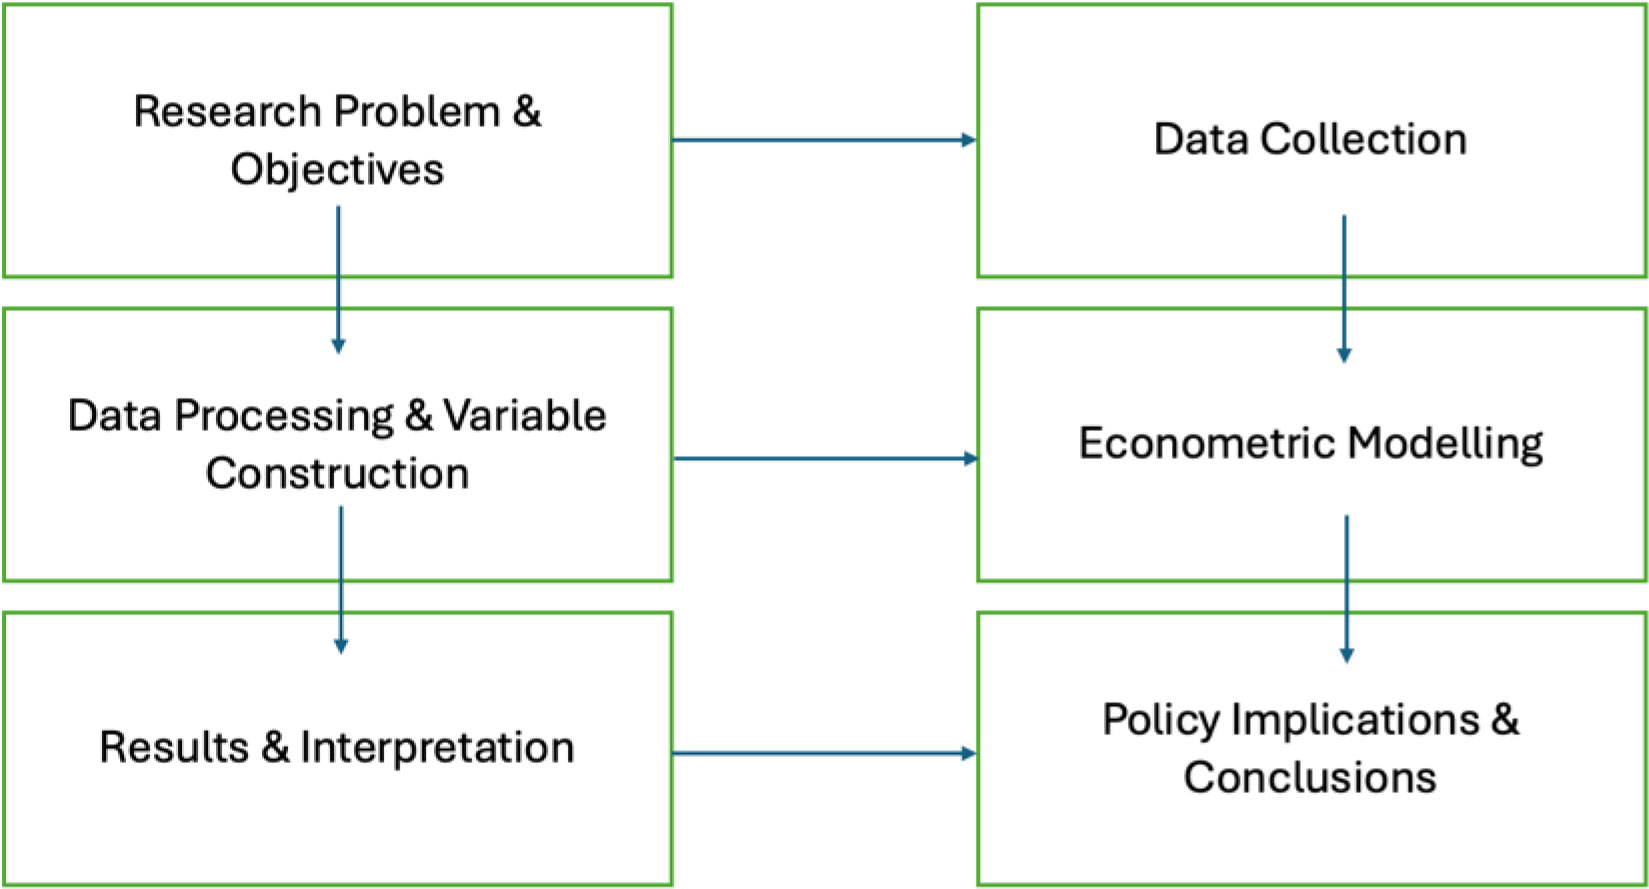
Study framework for the dynamic panel analysis of road capacity and traffic demand in Rawalpindi Division.
Dynamic panel data models are employed in this study to capture the lagged effects of VKT on current traffic demand. These models effectively address situations where the dependent variable is influenced by its past values, a phenomenon common in transportation studies. However, the inclusion of lagged dependent variables introduces endogeneity, which can result in biased and inconsistent parameter estimates if not handled properly. To overcome this challenge, the Arellano-Bond first-difference GMM estimator and the Blundell-Bond system GMM estimator are utilized. The dynamic panel data model can be represented as follows:
log (VKTit) = α log (VKTi,t-1)+Xitβ + ηi + ϵit.....(1)
Where log (VKTit) is the natural logarithm of vehicle kilometers travelled for road-link i in year t; log (VKTi,t-1) is the lagged dependent variable, Xi,t is a vector of explanatory variables including log (vehicle ownership), log (lane-kilometers), log (fuel price), and log (population growth rate), β represents the coefficients of the explanatory variables, ηi denotes unobserved road link-specific fixed effects, and ϵit is the idiosyncratic error term. Eq. (1) represents the baseline dynamic specification estimated in levels prior to transformation into first differences for GMM estimation.
3.2. Estimation Techniques
3.2.1. Arellano-bond First-difference GMM
This estimator removes the road link specific effects (ηi) by first differencing the equation, which yields:
ΔLog (VKTit) = αΔLog (VKTi,t-1)+ΔXitβ + Δϵit.....(2)
Lagged levels of the dependent and independent variables, Log (VKTi,t-2), Xi,t-2 are used as instruments for the first-differenced variables, assuming these lagged levels are uncorrelated with the first-differenced error term. Eq. (2) shows the first-differenced form used in the Arellano–Bond estimator to eliminate time-invariant link effects.
3.2.2. Blundell-bond System GMM
This estimator combines the first-differenced equation with the original level equation, introducing additional moment conditions to improve efficiency:
Log (VKTit) = αLog (VKTi,t-1)+Xitβ + ηi + ϵit.....(3)
Lagged differences αΔLn (VKTi,t-1) and ΔXi,t-1 are used as instruments for the level equations under the assumption of orthogonality between differenced instruments and fixed effects. Eq. (3) forms the level equation component of the System GMM estimator, combined with Eq. (2) to improve efficiency under additional moment conditions.
To validate the models, diagnostic tests are conducted to ensure the robustness and reliability of the econometric framework. The AR(1) and AR(2) tests are employed to evaluate first-order and second-order serial correlation in the residuals. As expected, first-order autocorrelation AR(1) is typically present due to the differencing process; however, the absence of second-order autocorrelation AR(2) is crucial for the consistency of the GMM estimators. Additionally, the Sargan test is used to assess the validity of the instruments by examining whether the over-identifying restrictions are satisfied. A non-significant p-value from the Sargan test indicates that the instruments are uncorrelated with the error term and appropriately specified. By addressing the endogeneity of the lagged dependent variable and incorporating robust diagnostic measures, this econometric framework ensures reliable estimation of the relationship between road infrastructure expansion and travel demand in the Rawalpindi Division.
4. RESULTS
4.1. Descriptive Statistics
A descriptive overview of the dataset provides important context for the 69 road segments analyzed in Rawalpindi Division over 2014–2023. As shown in Table 2, the dependent variable, log-transformed Vehicle-Kilometers Travelled (log (VKT)), has a mean of 17.31 and a standard deviation of 1.33, indicating substantial variation in traffic volumes across links and years. Among the explanatory variables, log (vehicle ownership) shows moderate dispersion (mean = 11.23, SD = 0.52), reflecting gradual increases in motorization over the study period. The distribution of log(lane-kilometers) (mean = 3.27, SD = 1.15; min = 0, max = 5.61) corresponds to an average of roughly 26 lane-kilometers per link and points to pronounced differences in capacity across segments, driven by phased widening and network improvements. The mean of log (fuel price) (4.70) is consistent with an average pump price of around PKR 110 per liter, while log (population growth rate) (mean ≈ 0.80) corresponds to an annual population growth rate in the range of roughly 2–2.5%, in line with official statistics. Together, the observed range and dispersion of these variables underscore the suitability of a panel-data approach for examining how changes in road capacity are associated with traffic demand, while controlling for both time-invariant link characteristics and time-varying contextual factors.
| Variable | Obs | Mean | Std. Dev. | Min | Max | Units |
|---|---|---|---|---|---|---|
| log (VKT) | 621 | 17.306 | 1.325 | 12.883 | 19.679 | log of kilometers/year |
| log (vehicle ownership) | 621 | 11.233 | 0.525 | 10.088 | 11.633 | log of total vehicles |
| log (lane-km) | 621 | 3.273 | 1.151 | 0 | 5.606 | log of lane-kilometers |
| log (fuel price) | 621 | 4.702 | 0.449 | 4.188 | 5.621 | log of PKR/liter |
| log (population growth rate) | 621 | 0.803 | 0.086 | 0.742 | 0.924 | log of annual % growth |
Note: All variables are transformed using natural logarithms. Units correspond to the original (non-logged) values. Decimals reflect the log-transformed scale.
4.2. Correlation Analysis
The correlation matrix is shown in Table 3. It shows that log (VKT) is strongly and positively correlated with log(lane-kilometers) (0.85), consistent with higher traffic volumes on higher-capacity segments. Most pairwise correlations among the remaining covariates are modest; however, log (vehicle ownership) and log (fuel price) are strongly negatively correlated (–0.95), indicating potential multicollinearity between these two controls. We therefore interpret their individual coefficients cautiously, noting that the estimated lane-kilometers elasticity remains the focus of inference.
| log (VKT) | log (vehicle ownership) | log (lane-km) | log (fuel price) | log (population growth rate) | |
|---|---|---|---|---|---|
| log (VKT) | 1.000 | –0.056 | 0.851 | 0.060 | –0.045 |
| log (vehicle ownership) | - | 1.000 | –0.035 | –0.952 | 0.369 |
| log (lane-km) | - | - | 1.000 | 0.038 | –0.045 |
| log (fuel price) | - | - | - | 1.000 | –0.496 |
| log (population growth rate) | - | - | - | - | 1.000 |
Note: The strong negative correlation between fuel price and vehicle ownership indicates potential multicollinearity between these two variables; they are retained as controls, but their individual coefficients are interpreted with caution.
In addition to the correlation matrix, Fig. (3) presents a scatter plot of log (VKT) against log(lane-kilometers) for all 621 road–year observations, together with a fitted regression line. The figure confirms a strong, approximately linear relationship between capacity and traffic volumes across links and years, visually reinforcing the high bivariate correlation reported in the correlation matrix. The upward-sloping pattern anticipates the positive elasticity estimates obtained in the regression models, indicating that road segments with greater lane-kilometers systematically carry higher levels of traffic demand.
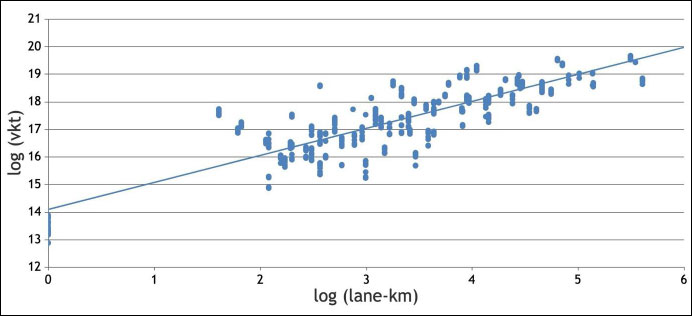
Scatter plot of log (VKT) against log (lane-kilometers) for 69 road segments in Rawalpindi Division (2014–2023), with fitted regression line.
4.3. Parameter Estimates
To assess the robustness of the estimated lane-kilometre elasticity and address potential endogeneity, we report results from multiple estimators: Ordinary Least Squares (OLS), Fixed Effects (FE), Random Effects (RE), Difference GMM (Arellano–Bond), and two-step System GMM (Blundell–Bond). Dynamic panel estimators are warranted because road capacity and traffic volumes may be jointly determined (e.g., capacity upgrades are often targeted to high-demand corridors) and because traffic may exhibit persistence over time.
In the Difference GMM specification, the model is first-differenced to remove time-invariant link effects, and internal instruments are constructed using lagged levels of the dependent variable and selected regressors (with lags starting from t–2). In the System GMM specification, the differenced equation is combined with the level equation, using lagged differences as instruments for the level equation under standard moment conditions. To reduce the risk of instrument proliferation, the instrument set is restricted and reported alongside standard specification tests.
Table 4 summarizes coefficient estimates and robust p-values for all models. In the preferred System GMM specification, the elasticity of VKT with respect to lane-kilometres is positive and statistically significant, while fuel price, vehicle ownership, and population growth rate are statistically insignificant conditional on included controls. The key results from all models are synthesized in Table 4.
| Variable | OLS Estimate | FE Estimate | RE Estimate | Diff-GMM Estimate | Sys-GMM Estimate | |||||
|---|---|---|---|---|---|---|---|---|---|---|
| Estimate | P-value | Estimate | P-value | Estimate | P-value | Estimate | P-value | Estimate | P-value | |
| log (vehicle ownership) | –0.067 | 0.831 | –0.060 | 0.423 | –0.062 | 0.436 | 0.035 | 0.805 | –0.078 | 0.530 |
| log (lane-km) | 0.960 | 0.0001 | 0.075 | 0.418 | 0.278 | 0.001 | 0.627 | 0.182 | 0.967 | 0.038 |
| log (fuel price) | 0.019 | 0.961 | 0.057 | 0.546 | 0.048 | 0.627 | 0.028 | 0.872 | –0.001 | 0.996 |
| log (population growth rate) | 0.214 | 0.752 | –0.069 | 0.675 | –0.004 | 0.981 | 0.088 | 0.532 | 0.173 | 0.118 |
| L.log (VKT) | - | - | - | - | - | - | 0.338 | 0.504 | –0.005 | 0.992 |
| Constant | 14.99 | 0.008 | 17.62 | 0.000 | 17.02 | 0.000 | 9.80 | 0.296 | 15.29 | 0.079 |
| R-squared / Wald χ2 | 0.623 | - | 0.167 | - | 0.601 | - | 71,193.5 | - | 56,282.3 | - |
| m1 AR(1) | - | - | - | - | - | - | –0.10 | 0.918 | –0.12 | 0.903 |
| m2 AR(2) | - | - | - | - | - | - | –0.95 | 0.342 | –0.99 | 0.322 |
| Sargan | - | - | - | - | - | - | 13.05 | 0.071 | 0.10 | 0.749 |
| Hansen | - | - | - | - | - | - | 8.98 | 0.254 | 0.07 | 0.795 |
Note: p-values are based on heteroscedasticity-robust standard errors.
4.4. Model Diagnostics and Robustness
We evaluate dynamic panel validity using the Arellano–Bond tests for serial correlation in differenced residuals and tests of over-identifying restrictions. The critical requirement for GMM consistency is the absence of second-order serial correlation in the differenced errors. As reported in Table 4, the AR(2) test is not statistically significant in both Difference GMM and System GMM (p-values > 0.30), indicating no evidence of problematic second-order correlation. AR(1) is reported for completeness.
Instrument validity is assessed using the Sargan and Hansen tests of over-identifying restrictions. In the preferred System GMM specification, the Hansen test does not reject the instrument set (p = 0.795), and the Sargan test similarly does not reject (p = 0.749). In the Difference GMM specification, the Sargan p-value is marginal (p = 0.071), so the System GMM results are emphasized for inference.
Finally, the Hausman test rejects the Random Effects specification (p < 0.01), supporting the use of FE-type estimators and motivating the reliance on dynamic GMM to address remaining endogeneity concerns, as in all GMM applications, inference is based primarily on the absence of AR(2) and on over-identification tests, which are satisfied in the preferred System GMM specification.
5. DISCUSSION
5.1. Interpreting the Elasticity of Road Capacity
The preferred System GMM specification yields a near-unitary elasticity of log (VKT) with respect to log(lane-kilometers) (≈0.97), indicating that a 1% increase in measured road capacity is associated with an almost 1% increase in total traffic demand. This estimate should be interpreted as a robust conditional association, not a fully identified one-way causal effect, because capacity changes may still correlate with unobserved demand pressures and policy priorities. Accordingly, we refer to this coefficient as a demand elasticity (VKT response) rather than a pure estimate of only ‘new-trip’ demand. Because VKT aggregates all motorized vehicle-kilometers, the estimated elasticity reflects overall changes in observed traffic demand-including new trips, diversion/rerouting, and longer trips-following capacity expansion. Because the sample consists solely of existing links that underwent widening, the estimated elasticity specifically captures the average response to lane additions on existing corridors, rather than a mixture of greenfield roads and widening projects. The magnitude of this response is substantial and broadly comparable to elasticities reported in international studies [9, 29, 31], suggesting that strong demand responses to capacity expansion are not confined to high-income contexts but also arise in rapidly urbanising South Asian settings where road building remains a dominant policy tool.
At the same time, this near-unit elasticity admits more than one interpretation. One reading, consistent with the traffic demand literature, is that additional capacity enables and attracts additional traffic, so that congestion relief is temporary. An alternative reading, in line with the “predict and provide” paradigm, is that planners have adjusted capacity to areas of already high or growing demand, such that demand has, in part, prompted supply. Our dynamic panel estimates therefore provide evidence of a tight equilibrium relationship between capacity and traffic, but should not be viewed as a fully identified one-way causal effect of capacity on demand. From a modelling standpoint, the fact that similar elasticities emerge across multiple estimators (OLS, RE, and System GMM) reinforces the robustness of the association, while the lower and insignificant fixed-effects estimates likely reflect limited within-link variation in capacity over the relatively short panel. The dynamic GMM framework helps to control for persistence and some forms of endogeneity, but the results are still best interpreted as indicative gross demand elasticities rather than precise causal impacts. In the preferred, more parsimonious GMM specification, the lagged dependent variable becomes statistically insignificant, suggesting that once common shocks and serial correlation are differenced out and instrumented, residual dynamic persistence in VKT is weak; capacity changes appear to be absorbed largely contemporaneously rather than through long-lived traffic inertia.
The insignificant coefficient on the lagged dependent variable can arise in annual, link-level panels with a short time dimension (T = 9) when traffic adjusts quickly to contemporaneous corridor conditions and common shocks are absorbed through differencing and instrumentation. In this setting, widening existing corridors can translate into near-immediate traffic reallocation (route and time shifts) and additional trip-making within the same year, leaving limited incremental explanatory power for last year’s VKT once lane-kilometers and other controls are included. A further possibility is attenuation from measurement and aggregation: VKT is constructed from administrative traffic counts and annualized, which can reduce the signal in the lag term after first-differencing. We therefore interpret the dynamic term as indicating weak residual persistence in VKT conditional on capacity and controls, rather than as evidence against behavioral adjustment.
5.2. Insights from other Variables
Surprisingly, vehicle ownership does not emerge as a statistically significant predictor of VKT, even though it is often used as a proxy for motorization in transport modeling. One possible explanation lies in the composition of the vehicle fleet. In Rawalpindi Division, two- and three-wheelers dominate registrations, but annual mileage and trip lengths differ by vehicle class; therefore, changes in total ownership may not map cleanly to link-level VKT. As a result, increases in overall vehicle ownership may not translate proportionally into higher road usage, especially in terms of distance covered or road occupancy.
Fuel prices are statistically insignificant across specifications, likely because they are administratively adjusted and therefore may not transmit a smooth marginal cost signal in the short run. This likely reflects both institutional and behavioral constraints. In Pakistan, fuel prices are partially regulated and often subsidized, which reduces consumer sensitivity to marginal price changes. Moreover, even in the presence of price variation, short-run travel behavior in urban and peri-urban corridors may remain inelastic due to the lack of viable alternatives, such as comprehensive public transport or non-motorized infrastructure. Thus, policy levers like fuel taxation may have limited immediate impact on traffic volumes unless accompanied by broader modal shift options.
Population growth rate, while a key macro driver of aggregate mobility demand, does not significantly affect segment-level VKT in this study. This outcome suggests that travel patterns are more strongly influenced by the physical availability of infrastructure (i.e., road supply) than by district-level demographic changes. Given that the unit of analysis is the road segment rather than the household or individual level, broader population trends may be too coarse to capture localized demand variations. Because population growth rate is measured at the district level and varies relatively little over 2014–2023, it is a coarse proxy for the link-level demand base and is therefore not expected to exhibit a strong bivariate relationship with segment-level VKT.
The statistical insignificance of vehicle ownership and fuel price should not be interpreted as a lack of relevance but rather as a reflection of Pakistan’s institutional and structural context. Fuel prices in the country have historically been regulated and partially subsidized, limiting consumer responsiveness to price fluctuations. Data limitations that prevent the disaggregation of vehicle types further constrain the precision of these estimates. Consequently, the weak statistical significance of these variables highlights the importance of contextual and structural factors that shape travel behavior and market responses in Pakistan’s transport system. We explored including coarse indicators of vehicle composition, but inconsistent class definitions across years and strong multicollinearity with total vehicle ownership led to unstable coefficients. As a result, composition effects are discussed qualitatively rather than modelled explicitly.
5.3. Policy and Planning Implications
The central implication of the near-unit elasticity estimate is that expanding road capacity is likely to generate a proportional increase in traffic volumes, thereby offsetting any potential congestion relief over time. A near-unit elasticity implies that conventional widening is likely to be followed by traffic growth that rapidly erodes travel-time gains; therefore, capacity projects should be screened and appraised as accessibility projects rather than congestion-relief projects. At the city scale, these corridor packages can be reinforced by expanding high-quality mass transit and coordinating land use around stations, while applying pricing/parking and access-management tools on the same corridors where capacity is added.
5.4. Methodological Considerations and Caveats
This study uses log-transformed VKT as the demand measure. Because VKT is constructed from aggregate motorized traffic counts, it captures overall changes in observed traffic volumes associated with capacity changes, including both newly generated travel and traffic that is diverted or rerouted. Given the wide variation in how ‘induced demand’ is defined in practice [51], we do not claim to isolate only the new-trip component; instead, we interpret the coefficient on log(lane-kilometers) as the demand elasticity of VKT with respect to capacity, conditional on the included controls.
Several data-related caveats merit mention. First, the inability to distinguish between passenger and freight traffic may obscure heterogeneity in trip purposes and modal impacts. Second, changes in capacity are measured in terms of lane-kilometers on existing links that undergo widening; our data do not include new greenfield roads, so the results apply specifically to lane additions on existing corridors. Third, due to the nature of administrative data, no instances of capacity reduction (e.g., road dieting, pedestrianization) were observed-limiting the ability to evaluate counterfactual effects or symmetry in demand response.
Finally, the analysis assumes independence across road segments, yet in reality, some substitution or spillover effects may exist-particularly if multiple roads serve overlapping travel sheds. A future extension using spatial panel data models or road network-based accessibility indices could address this limitation more directly.
5.5. Contribution to Literature
This study makes a novel empirical contribution by applying dynamic panel estimation techniques (Arellano–Bond and Blundell–Bond GMM) to investigate traffic demand in a developing country setting-specifically Pakistan. Prior work on the topic has largely focused on high-income urban areas with better data availability and more stable institutions. By contrast, this analysis leverages a unique dataset of 69 road segments across 9 years (2014–2023), integrating infrastructure, economic, and behavioral indicators into a unified estimation framework.
Importantly, the study addresses endogeneity and serial correlation-challenges often neglected in conventional transport regression models in South Asia. The combination of multiple GMM specifications, including alternative lag and instrument structures, lends robustness to the results and strengthens inference by mitigating key endogeneity concerns common in observational road-traffic datasets.
The findings offer critical input for Cost-Benefit Analysis (CBA), Environmental Impact Assessments (EIAs), and transport master planning under frameworks such as CPEC, provincial ADPs, and multilateral funding proposals. As such, they provide a replicable methodological template and actionable insights for transport policymakers across similar emerging urban contexts.
CONCLUSION
This study provides robust empirical evidence on the phenomenon of traffic demand in the Rawalpindi Division of Punjab, Pakistan, using a dynamic panel data framework spanning 69 road segments over a nine-year period (2014–2023). By employing advanced econometric techniques-particularly the two-step System GMM estimator-the analysis effectively addresses endogeneity and persistence issues commonly encountered in transport demand modeling. The results demonstrate a strong and statistically significant relationship between road capacity and VKT, with an estimated elasticity of 0.967. This near-unitary elasticity is consistent with a near-proportional association between capacity expansion and traffic volumes, thereby offsetting the intended congestion relief benefits of capacity expansion.
The findings contribute to the growing international literature on traffic demand, offering one of the first applications of dynamic panel data in a South Asian context. The results highlight that traditional road expansion strategies, while effective in the short term, may be counterproductive in the long run if not accompanied by complementary demand management policies. Vehicle ownership, fuel prices, and population growth rate were found to have statistically insignificant effects on traffic volumes once the influence of infrastructure supply was accounted for. These patterns reflect Pakistan’s unique institutional context-characterized by regulated fuel markets, dominance of small vehicles, and limited modal alternatives.
From a policy standpoint, the findings emphasize the urgency of transitioning from road-centric infrastructure planning to integrated and sustainable mobility strategies. Enhancing the Metrobus Bus Rapid Transit (BRT) system, introducing congestion pricing mechanisms, promoting Transit-Oriented Development (TOD), and coordinating land-use planning with transport investment are critical steps to mitigate the rebound effects of traffic demand. Incorporating multimodal and non-motorized transport options into future projects under the China–Pakistan Economic Corridor (CPEC) framework can further enhance accessibility while curbing excessive private vehicle dependency.
Methodologically, this study demonstrates the value of dynamic panel estimation for transport policy analysis, particularly in data-limited developing contexts. Nonetheless, several limitations warrant attention. The absence of disaggregated data distinguishing passenger from freight flows and the inability to differentiate between new roads and lane expansions constrain the precision of the estimated elasticities. Moreover, no records of capacity reductions were available, precluding an assessment of potential asymmetry in demand responses. Future research could extend this work by incorporating spatial econometric models, accessibility indices, and disaggregated traffic counts to capture network-level interactions and behavioral feedback more comprehensively.
In conclusion, while road expansion remains a politically appealing response to congestion, this study empirically demonstrates that such measures can exacerbate the very problem they aim to solve. Sustainable transport solutions in Pakistan must therefore integrate infrastructure investment with demand management, multimodal coordination, and land-use reform to ensure long-term urban mobility, economic efficiency, and environmental sustainability.
AUTHORS’ CONTRIBUTIONS
The authors confirm their contribution to the paper as follows: S.L.: Conceived the study, supervised the research, and led the interpretation of findings; K.S.: Curated the data, conducted the formal analysis, prepared figures, and drafted the manuscript.
Both authors contributed to the study design, revised the manuscript critically for important intellectual content, and approved the final version.
LIST OF ABBREVIATIONS
| AB | = Arellano–Bond |
| ADPs | = Annual Development Programs |
| AR(1) | = First-order autocorrelation |
| AR(2) | = Second-order autocorrelation |
| BRT | = Bus Rapid Transit |
| C&W | = Communication and Works Department |
| CBA | = Cost-benefit Analysis |
| CPEC | = China–Pakistan Economic Corridor |
| COVID-19 | = Coronavirus Disease 2019 |
| DPD | = Dynamic Panel Data |
| EIAs | = Environmental Impact Assessments |
| FE | = Fixed Effects |
| GMM | = Generalized Method of Moments |
| OLS | = Ordinary Least Squares |
| PBS | = Pakistan Bureau of Statistics |
| PCU | = Passenger Car Unit |
| PKR | = Pakistani Rupee |
| PSO | = Pakistan State Oil |
| RE | = Random Effects |
| Sys-GMM | = System Generalized Method of Moments |
| TOD | = Transit-oriented Development |
| VKT | = Vehicle Kilometers Travelled |
| VMT | = Vehicle Miles Travelled |
AVAILABILITY OF DATA AND MATERIALS
All data generated or analyzed during this study are included in this published article.
ACKNOWLEDGEMENTS
This work was financially supported by the Korea International Cooperation Agency (KOICA) as part of the KOICA Global Fellowship Program (CIAT).

