All published articles of this journal are available on ScienceDirect.

Examining the Effects of Large Transport Projects on Local Economic Development and Land uses: The case of the Southern Sector of the Athens Metropolitan Area
Abstract
Introduction
While a substantial body of literature explores the relationship between transport infrastructure and urban development, empirical evidence combining macro- and micro-scale impacts in Southern European metropolitan contexts remains limited. This study addresses this gap by investigating the effects associated with the opening of new metro stations (Line 2) on local economic development and land-use change in the southern sector of the Athens Metropolitan Area.
Methods
Employing a multi-scale approach combining macro-level statistical analysis and micro-scale geospatial analysis using Geographic Information System (GIS) tools, the study evaluates changes in employment, car ownership, objective property values, and economic activities (reflected as land uses) before and after the construction of the new stations (2011-2021).
Results
The results indicate a statistically significant increase in total employment and employment in the accommodation and catering sector, alongside an increase in the share of carless households. Objective property values and economic activities exhibited notable growth near metro stations, with spatial variation, pointing to local economic revitalisation but also emerging risks of gentrification.
Discussion
The findings underscore the contradictory role of rail-based transport infrastructure as both a catalyst for local economic growth and a driver for societal challenges in Southern European metropolises. This outcome underlines the need for accompanying policy measures to ensure socially equitable and sustainable urban development. More specifically, economic and spatial strategies should include measures to support local businesses, promote sustainable mobility, and regulate property values.
Conclusion
This research contributes to the broader discourse on the interrelation between transport infrastructure and urban development in evolving metropolitan contexts. The findings may be beneficial to policymakers, transport providers, and local communities. Finally, the research methodology could be applied to other similar metropolitan contexts.
1. INTRODUCTION
Contemporary urban environments and their individual elements, such as urban planning regulations, transport and energy infrastructure, supply chain operations, and optimised delivery routing, provide an adequate basis for the emergence and operation of various economic activities [1-5], while also playing a crucial role in economic development at the local and metropolitan level [6-9]. It is therefore meaningful to explore in depth the relationship between urban transport infrastructure and the location of economic activities (shops, restaurants, tourist facilities, etc.) [10] and the overall economic development of an urban area in terms of employment, property values, spatial economic inequity, etc. [11-13]. In this context, this paper examines changes in terms of institutional property values, employment and economic activities (shops, restaurants, offices, etc.) in the southern sector of Athens where metro stations of Line 2 were recently constructed. Specifically, the research focuses on the Ilioupolis, Alimos, Argyroupolis, and Elliniko metro stations, which began operating in 2013. This area was selected for two reasons: first, the metro stations were opened relatively recently as part of a large-scale urban transport project, and second, the southern suburbs have attracted growing interest as a zone of emerging urban development within the Athens metropolitan area.
The study is conducted on both macro- and micro-scales and examines key attributes at the municipal level as well as at a local area consisting of buffer areas around each new metro station. The methodology mainly includes statistical analysis and geospatial analysis based on data from the Hellenic Statistical Authority for 2011 and 2021, land value data, as well as land use data. The basic research question is whether, and to what extent, the new metro stations have affected local economic development in their wider area. This main research question can be divided into three sub-questions: a) what are the effects on local employment, b) how these new stations influence objective property values, and c) is there any significant change to economic activities in the surrounding areas of the metro stations?
At this point, it should be stressed that rather than proposing a new theory, this study aims to provide empirical evidence and a generalisable analytical framework for assessing the local economic and spatial impacts of new large-scale transport infrastructure in metropolitan environments. The structure of the paper is as follows: It outlines the theoretical background, followed by the methodological framework and the description of the study area. It then demonstrates the results and concludes with a discussion of the key findings and policy implications.
2. THEORETICAL BACKGROUND
Cities are transforming and creating new conditions, challenges, and opportunities [4, 14]. The evolution, operation and structure of cities have a significant impact on economic activities, which in turn influence the very character of urban areas [15]. Therefore, spatial analysis and location implications are crucial for future urban development [16]. Transport infrastructure is a critical parameter for the operation and efficiency of a city [17]. According to relevant literature, various transport projects (ranging from motorways to bicycle networks) are particularly relevant to development issues and prospects, significantly influencing urban and regional development [18]. In particular, transport infrastructure is considered a key driver of economic restructuring, expanding accessibility and improving connectivity between regions and urban centres [19]. As noted in the relevant literature, these projects directly affect travel costs and duration, enhance regional attractiveness by increasing accessibility, and act as catalysts for development initiatives and investments [20-22]. Evidently, they may entail specific risks that have adverse consequences [23].
Focusing on urban areas and on the construction of rail-based transport stations, which are the backbone of public transport, i.e., metro network, trams, or urban railway in general, previous research demonstrates a close relationship between the development of urban centres and mixed economic activities, as well as more general economic development [24]. More specifically, the empirical study by Dziauddin [25] on Kuala Lumpur shows that proximity to light rail stations increases property values by 8% in middle- and lower-income groups, while the work of Mejia-Dorantes et al. [26] highlights the contribution of the Madrid metro to the spatial reallocation of business activities and the strengthening of agglomeration economies. Similarly, the study by Sharma & Newman [27] documents how the Bangalore metro boosted demand for housing even beyond traditional zones of influence, demonstrating the role of rail-based transport in the development of emerging metropolises. Another work from the North East of England by Pearson et al. [28] found that land value uplift emerges right after the construction of new metro stations, rather than in the long-term (15 years later). Bothe et al. [29] examined the case of Copenhagen and found that metro-served areas experience higher employment growth than non-served areas. The study by Xu et al. [30] found that urban rail has a positive impact on commercial property values in Wuhan. The same outcomes, indicating higher values, could be found in Napoli as well [31].
In light of the above, it should be noted that although existing studies have examined the impacts of metro and rail investments on employment, property values, and economic activities such as commercial and recreational uses, most focus either on macro-level indicators or on highly localised effects around stations, often in major global or developing cities. Fewer studies integrate these scales within a single analytical framework, particularly in Southern European metropolitan contexts characterised by contested urban fabrics, spatial and social segregation, informal housing, car-oriented mobility culture, and complex socio-economic characteristics [32-35]. This study builds on previous empirical research by adopting a multi-scale approach that links municipal-level socio-economic change with micro-scale spatial transformations around metro stations, articulating an empirical framework that is replicable in comparable metropolitan contexts.
3. METHODOLOGY
The methodological approach is summarised in Fig. (1). The study employs statistical and geospatial analysis tools to understand transformations in areas around metro stations that may be attributable to this large-scale transport project.
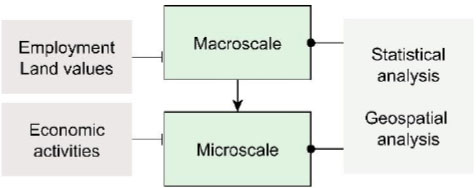
Methodological flow.
The analysis of changes in areas where metro stations were constructed is organised on two scales: macro and micro. On a macro-scale, the study focuses on the municipalities directly hosting a metro station and two neighbouring ones, namely Glyfada (neighbouring), Alimos (direct), Elliniko-Argyroupolis (direct), Agios Dimitrios (direct), Ilioupolis (direct), and Dafni-Ymittos (neighbouring). Regarding the profile and socio-economic characteristics of these municipalities, the most populated one is Glyfada (89,600 residents) and the least populated is Dafni-Ymittos (33,886 residents). Most of them, except Glyfada and Alimos, are middle-income areas with an average annual income of approx 23,388.3€ [36]. Concerning formal urban planning initiatives, most of these municipalities are characterised by wide areas where land-use mixture is permitted; again, Glyfada and Alimos stand out with substantial parts of residential-only development. The municipalities are depicted in Fig. (2).
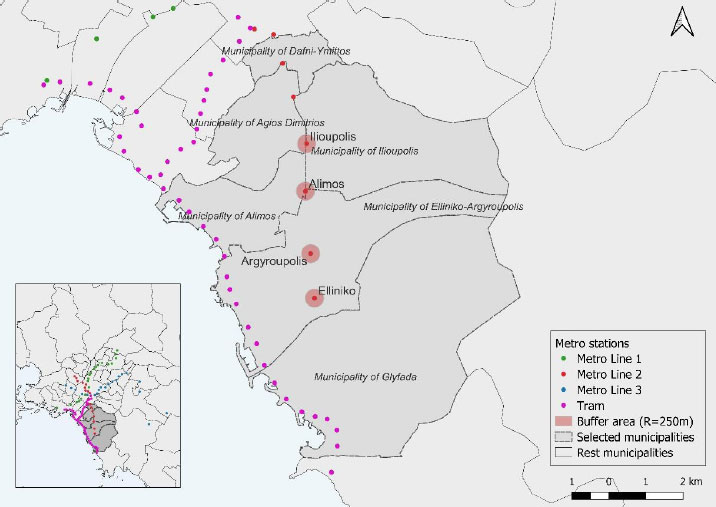
The study area consisting of metro stations and the surrounding municipalities (data: Hellenic Statistical Authority and Transport for Athens).
At the macro-scale, variables such as employment, lack of car ownership, and objective property values are examined with the aim of capturing change in the economic landscape in areas where the four metro stations were built. On the micro-scale, the focus shifts to the 250-metre radius zones around the four project stations (this threshold has also been adopted in relevant papers [37, 38]), where local economic activities and immediate land-use transformations are investigated (Fig. 2). The two-level study combines descriptive statistics with qualitative geospatial analysis using geovisualisation schemes, offering a relatively comprehensive tool for interpreting the transformations caused by the new transport infrastructure.
A significant tool used in this paper is the paired-samples t-test (paired t-test), which is a well-known statistical method for comparing the means of two related groups to determine whether there is a statistically significant difference between them [39]. It is usually employed when measurements refer to the same subject at two different times (e.g., before and after) or under two different conditions, making the data “dependent” or “paired” [40]. The paired t-test measures the difference between each pair of observations and then examines whether the average of these differences is significantly different from zero, assuming that the differences are normally distributed [41].
In this study, paired t-tests compare 2011 and 2021 values for total employment, employment in Sector Θ, and the percentage of carless households across the six municipalities and 2011 and 2021 objective property values across 24 land-value zones. Before applying the paired t-tests, the normality of the difference scores was assessed using Shapiro-Wilk tests and visual inspection of QQ-plots. The Shapiro-Wilk tests did not provide evidence against normality (p = 0.99 for total employment, p = 0.50 for Sector Θ, p = 0.44 for carless household shares, and p = 0.78 for property values). The QQ-plots likewise displayed no substantial departures from linearity, aside from minor deviations expected given the small number of municipalities. Consequently, the paired t-tests were considered appropriate and were complemented by non-parametric Wilcoxon signed-rank tests as a robustness check. Moreover, effect sizes (Cohen’s d for paired samples) and 95% confidence intervals for the mean differences are reported. At the micro-scale, the difference in economic-activity counts between 2011 and 2025 was tested using a paired t-test based on the block-level data; here, the large number of blocks (141 blocks) helps the normal approximation. The statistical analysis was conducted in SPSS and the statistical programming language R, while the open-source GIS software QGIS was used to visualise changes in land uses and objective property values.
Regarding the dataset, the macro-level analysis uses secondary data from the Hellenic Statistical Authority (ELSTAT) for the 2011 and 2021 population and housing censuses. The six municipalities retained identical administrative boundaries between 2011 and 2021, both censuses employ the NACE Rev. 2 classification system for employment sectors, and the questionnaire wording for car ownership is the same in both rounds. Objective land/property values are obtained from the land registry of the Ministry of Economy and Finance. On the micro-scale, primary data on land uses were collected through on-site observations and systematic inspection of Google Street View imagery from 2011 and 2025. The economic-activity metric used here counts the number of ground-floor activities within each building block, including retail stores, bars and restaurants, offices, accommodation, and medical-care establishments. Vacant premises were recorded separately to ensure transparency. The audit was carried out by a single coder following a standardised protocol applied consistently across all sites. Although inter-rater reliability statistics could not be calculated, the use of a uniform procedure helps limit potential inconsistencies. Finally, the period selected to investigate the potential effects of the metro system covers only two time points. This was chosen to harmonise the macro- and micro-scales in terms of analysis. Hence, the period before the opening of these new stations and the period after the operation were examined. This approach is consistent with other similar papers [42, 43].
4. RESULTS
At the macro level, the analysis concentrates on both total employment and employment in Sector Θ according to ELSTAT, which concerns “Accommodation and catering activities” and is an interesting indicator for understanding changes in the spatial-economic conditions in the study area (Table 1).
| Municipality | Total Employment | Employment “Accommodation and Catering” | ||||
|---|---|---|---|---|---|---|
| 2011 | 2021 | Change | 2011 | 2021 | Change | |
| Municipality of Dafni-Ymittos | 13,017 | 14529 | 11.62% | 744 | 1327 | 78.36% |
| Municipality of Ilioupolis | 30,527 | 32377 | 6.06% | 1,453 | 2613 | 79.83% |
| Municipality of Agios Dimitrios | 28,261 | 30798 | 8.98% | 1,523 | 2507 | 64.61% |
| Municipality of Alimos | 16,653 | 18028 | 8.26% | 791 | 1289 | 62.96% |
| Municipality of Glyfada | 34,153 | 36114 | 5.74% | 2,204 | 3104 | 40.83% |
| Municipality of Elliniko-Argyroupolis | 19,979 | 20852 | 4.37% | 1,229 | 1844 | 50.04% |
As shown in the Table 1 above, the change in both total and employment in Sector Θ is positive in all municipalities. In fact, the largest increases in total employment are found in the municipalities of Dafni-Ymittos, Agios Dimitrios, and Alimos, while in Sector Θ, the municipalities of Ilioupolis and Dafni-Ymittos appear to dominate.
Across the six municipalities, mean total employment increased from 23,765 jobs in 2011 (SD = 8,418) to 25,450 in 2021 (SD = 8,784). The mean paired difference is 1,685 jobs (95% CI [1,088; 2,281]). The paired t-test confirms that this change is statistically significant, t(5) = 7.26, p < 0.001, with a very large effect size (Cohen’s d = 2.96). The complementary Wilcoxon signed-rank test also indicates a significant increase (statistic = 0.0, p = 0.031). Employment in Sector Θ shows an even more pronounced shift. Mean employment rises from 1,324 workers in 2011 (SD = 540) to 2,114 in 2021 (SD = 742), i.e., an average increase of 790 jobs per municipality (95% CI [514; 1,066]). The paired t-test again shows a statistically significant change, t(5) = 7.36, p < 0.001, with a very large effect size (Cohen’s d = 3.01). The Wilcoxon signed-rank test indicates similar evidence of an increase (statistic = 0.0, p = 0.031).
These outcomes imply a substantial boost to the accommodation and catering sector across the wider area, in line with expectations that improved accessibility and increased footfall around metro stations can stimulate such activities. Nevertheless, as discussed later, the temporal overlap with the tourism boom and broader recovery from the pandemic means the changes cannot be attributed solely to the metro expansion. In brief, the findings demonstrate a statistically significant increase in total employment and a particularly strong expansion of accommodation and catering activities in municipalities hosting or neighbouring the new metro stations.
Table 2 presents the percentage of carless households. The table reveals a particularly interesting finding: the share of carless households increased across all municipalities, especially in Elliniko–Argyroupolis (15.15% increase).
| Municipality | Carless Households | ||
|---|---|---|---|
| 2011 | 2021 | Change | |
| Municipality of Dafni-Ymittos | 34.37% | 35.36% | 2.86% |
| Municipality of Ilioupolis | 23.94% | 25.90% | 8.19% |
| Municipality of Agios Dimitrios | 25.16% | 26.46% | 5.15% |
| Municipality of Alimos | 20.54% | 20.95% | 2.00% |
| Municipality of Glyfada | 16.76% | 17.81% | 6.31% |
| Municipality of Elliniko-Argyroupolis | 21.02% | 24.21% | 15.15% |
On average, the proportion of carless households increased from 23.63% in 2011 (SD = 6.02) to 25.12% in 2021 (SD = 5.98), an average rise of 1.48 percentage points (95% CI [0.46; 2.51]). The paired t-test indicates that this increase is statistically significant, t(5) = 3.73, p = 0.0136, with a large effect size (Cohen’s d = 1.52). The Wilcoxon signed-rank test provides similar evidence (statistic = 0.0, p = 0.031). Considering the economic conditions in Greece and Athens during this period, though, the economic crisis probably played a primary role in discouraging car ownership. However, the opening of the new metro stations may also have contributed by providing a substantial alternative to car use for everyday travel, especially in areas where the stations are easily accessible on foot. These trends imply a gradual (possibly forced) shift towards public transport use, although broader economic conditions during the study period may also have played a pivotal role.
The next indicator concerns the objective (institutional) values of land properties and how they changed between 2011 and 2021. The 2011 benchmark precedes both the metro opening and the main phase of the financial crisis and represents the most recent complete pre-crisis dataset. Figure 3a illustrates the spatial distribution of objective property values in 2011, before the metro opening and severe effects of the economic crisis, whereas (Fig. 3b) depicts the corresponding values in 2021. A comparison of these two subfigures indicates that most zones experienced an increase in objective property values, with particularly pronounced changes around the Argyroupolis and Elliniko stations, where the upcoming investment in the former Elliniko airport is also expected to have a strong impact. Ilioupolis is the only area where values remain relatively stable or even decrease slightly.
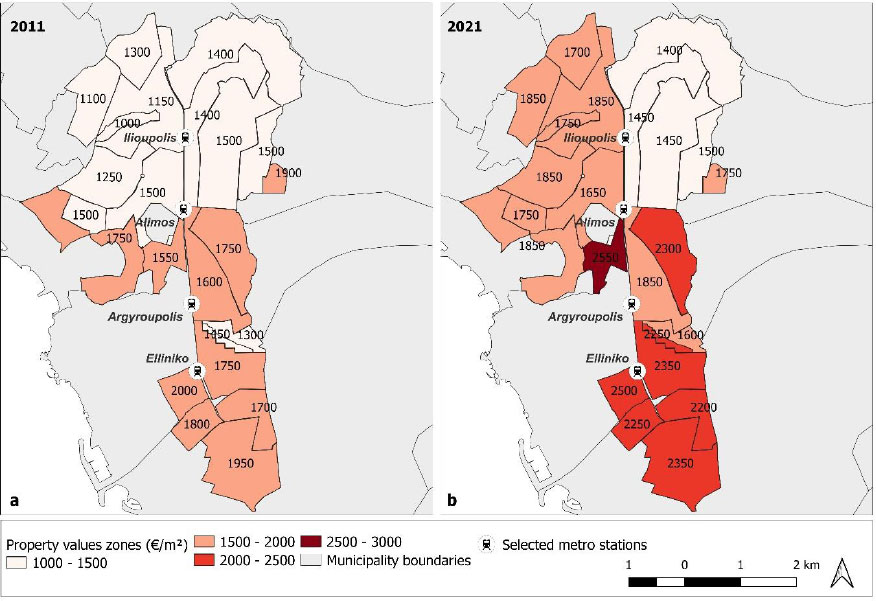
Objective property values in the study area (a) 2011 and (b) 2021 (data: Hellenic Statistical Authority and Ministry of Economic and Finance).
Across the 24 land-value zones, the mean objective value in 2011 was 1,529.2€ /m2 (SD = 277.4), rising to 1,908.3€/m2 in 2021 (SD = 353.7). This corresponds to an average nominal increase of 379.1€/m2 (95% CI [246.8€/m2; 511.4€/m2]). A paired t-test confirms that the increase is statistically significant, t(23) = 5.94, p < 0.001, with a large effect size (Cohen’s d = 1.21). A Wilcoxon signed-rank test provides consistent evidence of an upward shift (V = 10, p < 0.001).
However, interpreting these changes requires accounting for inflation and adjustments to the institutional valuation system. Based on the Consumer Price Index (data derived from ELSTAT), cumulative inflation in Greece between 2011 and 2021 was approximately 11% (10.8%). Applying this rate to the 2011 mean produces an inflation-adjusted expected value of roughly 1,722.3€/m2 in 2021. This means that while a large share of the nominal increase reflects inflation, an additional component may reflect genuine market pressure. Spatial distribution of increases reinforces this interpretation. As shown above, zones closest to Argyroupolis and Elliniko exhibit disproportionately strong growth, which may be associated with improved accessibility following the opening of Metro Line 2 stations and with expectations surrounding the large-scale redevelopment of the former Elliniko airport site.
Figure 4 illustrates the micro-scale analysis of economic activities within the buffer zones around the metro stations. In particular, (Fig. 4a) shows the distribution of ground-floor economic activities in 2011, while (Fig. 4b) depicts the situation in 2025.
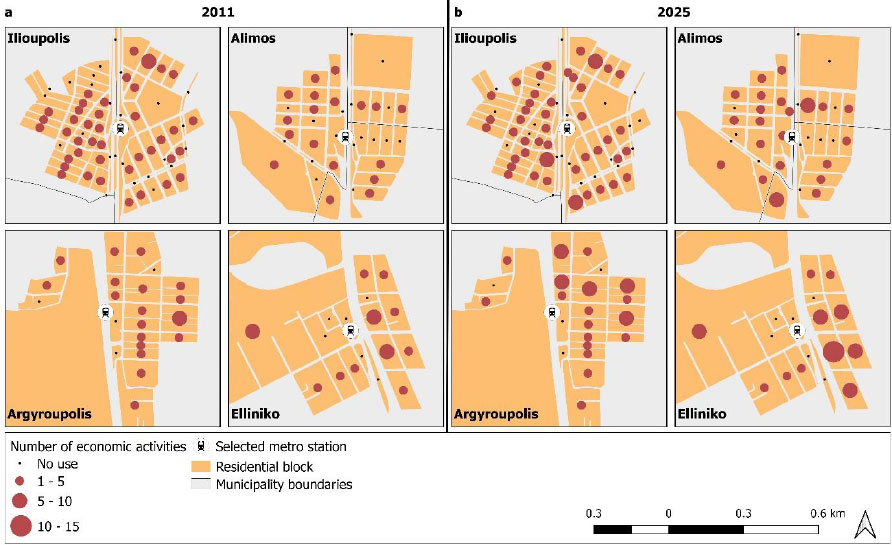
Spatial distribution of ground-floor economic activities (a) 2011 and (b) 2025 (data: On-site observations and Google Street View).
As expected, the comparison of these two subfigures (Fig. 4a, b) shows a considerable increase in economic activities in building blocks adjacent to most metro stations, reflecting localised growth over time. This is evident around all stations except Ilioupoli. This may be attributed to the fact that this station has already been locally developed, while the others experienced greater economic growth through the opening and operation of mainly dining and leisure facilities. The paired t-test indicated a significant increase in economic activity from 2011 (M = 1.65, SD = 1.80) to 2025 (M = 2.22, SD = 2.54), t(140) = 4.23, p < 0.001. This outcome highlights the role that large transport infrastructure projects can play in shaping local development. Taken together, property values and economic activities indicate noticeable localised growth in zones and areas near metro stations. However, this revitalisation could also entail societal risks [24]. Furthermore, spatial dependence among building blocks was formally examined using a Moran’s I test with a 5-nearest-neighbour spatial-weights matrix. The statistic for the change in economic-activity counts between 2011 and 2025 is very close to zero (Moran’s I = –0.0054), and a permutation test with 999 replications yields a non-significant p-value (p = 0.485). These results show no meaningful spatial autocorrelation in the pattern of differences. In other words, neighbouring blocks do not exhibit systematically similar or dissimilar patterns of change.
5. DISCUSSION
5.1. Key Findings
This study examined the relationship between new urban railway infrastructure and local economic development in a southern European metropolitan setting. Using the example of the newly constructed metro stations on Line 2 in the southern suburbs of Athens, a coherent analysis was carried out. This analysis combined macro-level socio-economic indicators with micro-scale spatial analysis, introducing a multidimensional approach. The outcomes signify a notable change in various simple economic and employment indicators around the wider area of the stations. The findings show that the presence of the metro stations coincides with a sizeable reduction in car ownership shares, as adequate public transport services can support a different rationale of transport behaviour [44, 45]. The results also showed that the development of the metro in the area may have contributed to a significant increase in employment, both overall and especially in Sector Θ. Along with these considerable transformations, property values and economic activities increased substantially, demonstrating local economic revitalisation but also raising concerns about social equity and potential gentrification in areas surrounding the stations. Previous studies have reached similar conclusions, such as the studies by Polyzos [19], Lin et al. [24], Roukouni et al. [46], Dziauddin [25], Sharma & Newman [27], and Mejia-Dorantes et al. [26], confirming the findings of the present study on both macro- and micro-scale. Solely in terms of employment growth, this study corroborates the findings of Bothe et al. [29], who reported strong employment growth in newly metro-served areas. All these studies emphasised the dynamics emerging from new large-scale transport infrastructure, which can have multiplying effects on surrounding areas. This paper, however, differs from the work of Pearson et al. [28], who did not find statistically significant differences in property values over the long term.
Based on the above, this study denotes that transport infrastructure could be a “stimulus” for growth and drastic transformation [47, 48]. However, despite its positive contribution to daily commuting and employment, it also carries risks related to the sharp increase in property values (in line with [24, 38, 49]). This finding may be related to the fact that certain areas around metro stations have experienced an increase of up to 64% (nominal values), a phenomenon that can lead to an alteration of the social characteristics of the area and gentrification issues [50]. Beyond the impact of the stations that have been constructed, it is important to envision the future of the wider area. Considering the expansion of the metro line 2 from Elliniko to Glyfada, as well as the enormous investment in the former airport in Elliniko, the area is expected to offer greater opportunities for travel by public transport and thus environmentally friendly travel with compelling social significance [24, 51]. Prominently, the risks posed by such a situation (increased property values) should not be underestimated but addressed effectively. Overall, the study denotes the contradictory role of urban railway infrastructure as both a catalyst for local economic growth and a driver for societal challenges in Southern European metropolitan areas.
5.2. Policy Suggestions
It should be underlined that supporting sustainable mobility involves not only establishing new infrastructure but also preventing any adverse impacts associated with such interventions. In this context, since the construction of metro stations is both an opportunity and a potential challenge [52], this paper proposes some indicative policy measures that could enhance the positive contribution of the metro system and mitigate its negative effects. A first measure could be to support businesses that are accessible by public transport. In this way, local businesses will support the construction of stations and benefit significantly from this kind of development, while also contributing to the environment. Furthermore, metro lines can be used as a network for small-scale freight transport, which is an integral part of the urban supply chain. In addition, employees could receive financial support for travelling by public transport. Finally, to address increasing property values, a fair way of regulating values could be established, keeping them at an acceptable level without the risk of altering the profile of the area around the metro stations. All these measures are rather critical to accompany public transport expansion with a fair spatial and economic policy framework. These two dimensions combined might lead to sustainable and fair urban development.
5.3. Methodological Implications
The approach employed in this research has the key advantage of integrating macro-scale socio-economic indicators (employment growth and car ownership) with micro-scale spatial analysis (property values and economic activities). By combining official census data, institutional property-value records, and detailed observations of economic activities, this integrative framework facilitates the identification of diverse changes around new metro stations. This multidimensional perspective provides a more cohesive understanding of transport-induced change compared to single-level approaches.
Another asset of the methodology is its reliance on real-world data sources (most of which are openly available), which ensures transparency and replicability. The process followed, and the tools employed, are relatively simple and can be implemented by planning authorities, transport providers, and researchers without the need for complex modelling or extensive resources, making the approach very suitable for applied policy analysis.
In terms of applicability, the proposed framework is well-suited to metropolitan contexts characterised by contested urban fabrics, segregation, and car-oriented mobility culture. While the empirical findings are specific to Athens, although this is important per se, the methodological approach is transferable and can be adapted to other similar cities aiming to evaluate the local economic impacts of large-scale transport infrastructure like metro systems or urban railway more broadly.
5.4. Contribution, Limitations, and Future Research
5.4.1. Contribution
The study adds to the literature on transport infrastructure and urban development in three main ways. First, it presents empirical evidence from a Southern European metropolitan context, which has received relatively little attention compared to major global cities. Second, it couples macro-level socio-economic indicators with micro-scale spatial analysis to capture both wider trends and localised changes around metro stations. This multidimensional approach is one of the most important methodological elements of this research. Third, it points out the coexistence of (local) economic revitalisation and societal risks, such as rising property values and potential gentrification, providing meaningful insights for transport and land-use policy.
5.4.2. Limitations
Despite its contribution, this paper is subject to several limitations that should be acknowledged. First, the present analysis supports a cautious interpretation: the observed patterns are consistent with a possible metro system effect but, on their own, cannot confirm causality. This is a key limitation of the research, underscoring the need for more robust examination in the future. In addition, not all possible parameters that could influence economic development due to the construction of the metro were studied. This means that the results may be affected by unobserved factors and that the variations may be due to other factors, overlapping external interventions or the general economic situation. It is also important to underline the role of the Elliniko investment and the gradual recovery from the COVID-19 pandemic and the economic crisis [53]. These events may also have a significant impact on the development of the area, complementing or even surpassing the construction of the new metro stations [54].
Additionally, the relatively simple statistical and geospatial techniques employed provide an overview of spatial change but do not capture more complex spatial spillovers or interactions. Finally, another significant limitation of the paper is that the temporal segmentation entails two time points. Further temporal segmentation was not applied in the quantitative analysis for methodological reasons. The macro-scale analysis relies on census data from 2011 and 2021, while the micro-scale land-use analysis is based on the same baseline year to ensure consistency and comparability across scales. However, in other cases, more detailed research focusing solely on the micro-scale should introduce multiple stages and, therefore, additional time points. These stages should cover the period before the opening of the metro stations, the years following their initial operation, which coincide with the economic crisis and the subsequent recovery stage.
5.4.3. Future Research
Considering the limitations of the paper, it is suggested that new research endeavours should employ more sophisticated geospatial tools and methodological approaches. A thorough analysis of the relationship between transport infrastructure and economic development under the prism of equity in multiple contexts will lead to better and more comprehensive policy measures and interventions, which in turn can offer a better quality of life. Future research could build on this work by employing temporally disaggregated datasets that allow for sub-period analysis and a more detailed examination of phase-specific urban and mobility dynamics. Furthermore, scenario development would be undoubtedly valuable in examining the impacts of new or proposed interventions. Lastly, as noted above, the proposed multi-scale, data-driven framework provides a transferable approach for assessing the local impacts of metro investments in similar metropolitan contexts. Subsequently, future research could employ quasi-experimental designs, more advanced and diverse statistical methods, as well as longer time series to isolate infrastructure effects and support more targeted policy interventions.
CONCLUSION
The findings imply that new large-scale transport infrastructure, like the expansion of the metro network in southern European metropolitan areas, could be associated with local economic growth (employment, economic activities, property values). This is confirmed by both macro-scale and micro-scale indicators. However, unintended risks like highly increased property values might ignite social exclusion phenomena. These outcomes contribute to the ongoing scientific debate on the impact of large-scale transport infrastructure on urban and local economic development. By elucidating these dynamics, the study provides guidance for policymakers and planners seeking to foster sustainable mobility while mitigating unintended consequences. Although it scrutinises a single metropolitan case, the (multidimensional) methodological approach is intended to be transferable and applicable to other cities facing similar challenges.
AUTHOR’S CONTRIBUTION
The author confirms sole responsibility for the following: study conception and design, data collection, analysis and interpretation of results, and manuscript preparation.
AVAILABILITY OF DATA AND MATERIALS
The data supporting the findings of the article are available in the following sources: a) the Hellenic Statistical Authority (ELSTAT) repository is available at https://www.statistics.gr/en/home/, b) the Land registry of the Ministry of Economy and Finance is available at https://maps.gsis.gr/valuemaps/, and c) Land uses were obtained through the Google Street View (https://www. google.com/streetview/).
CONFLICT OF INTEREST
The author, Dr. Stefanos Tsigdinos, is a member of the Editorial Board of The Open Transport Journal.
ACKNOWLEDGEMENTS
Declared none.

