All published articles of this journal are available on ScienceDirect.

Application of Multinomial Regression Model to Identify Parameters Impacting Traffic Barrier Crash Severity
Abstract
Background:
Run Off The Road (ROTR) crashes are some of the most severe crashes that could occur on roadways. The main countermeasure that can be taken to address this type of crash is traffic barrier installation. Although ROTR crashes can be mitigated significantly by traffic barriers, still traffic barrier crashes result in considerable amount of severe crashes. Besides, the types of traffic barriers, driver actions and performance play an important role in the severity of these crashes.
Methods:
This study was conducted by including only traffic barrier crashes in Wyoming. Based on the literature review, there are unique contributory factors in different crash types. Therefore, in addition to focusing on traffic barrier crashes, crashes were divided into two different highway classes: interstate and non-interstate highways.
Results:
The result of proportional odds assumption was an indication that multinomial logistic regression model is appropriate for both non-interstate and interstates crashes involved in traffic barriers. The results indicated that road surface conditions, age, driver restraint and negotiating a curve were some of the factors that impact the severity of traffic barrier crashes on non-interstate highways. On the other hand, the results of interstate barrier crashes indicated that besides the types of barriers, driver condition, citation record, speed limit compliance were some of the factors that impacted the interstate traffic barrier crash severity.
Conclusion:
The results of this study would provide the policymakers with the directions to take appropriate countermeasures to alleviate the severity of traffic barrier crashes.
1. INTRODUCTION
Despite the relatively low-rate of roadside crashes (15-20%), the severity of these crashes has been overrepresented. More than 60% of the fatalities on roadways resulted from Run-Off-The-Road (ROTR) crashes in the US [1]. Therefore, it is vital to give special attention to the design and condition of roadsides. As one of the popular safety countermeasures of roadsides, traffic barrier has been used for decades to reduce the severity of roadside crashes. Despite the published results about the associated benefits of traffic barrier, especially in crash severity reduction, traffic barriers are deteriorating.
Recent studies were conducted to evaluate the impact of various characteristics of the median traffic barriers on crash severity by utilizing ordered logit regression [2, 5]. All these studies concluded that the cable systems are the safest type of traffic barriers in terms of reducing the severity. Also, the probability of a high-severity crash is very high if a motorcycle hits the traffic barrier. However, a few inconsistencies were found in these studies, the most major one being speed limit, which was not investigated in the model presented by Zou et al. as the crash frequency was too low to be analyzed in the study [3].
Molan et al. [5] developed a severity model for the truck crashes involving traffic barriers in Wyoming. It was found that the probability of experiencing a severe injury is higher in truck crashes hitting guardrails in comparison to other traffic barrier types (cable and concrete). Almost half of truck crashes involving guardrails resulted in a rollover.
Russo and Savolainen [2] also found a higher severity for crashes in the locations with lower-speed limit. This finding was against the general belief about the direct effect of speed on crash severity. The authors claimed that the reason might be due to the high standard division existing for some low-speed limit areas which resulted in a safety concern in terms of severity.
Li et al. (2017) [6] presented a crash severity model for traffic barriers located in road departures and found that cable barriers decreased the probability of severe injury crashes in comparison to guardrails. Based on the results, crash severity could be reduced up to 50% in road departures with traffic barrier presence compared to the departures with no traffic barrier.
The Pennsylvania Department of Transportation conducted a field study to propose a uniform statewide condition evaluation for traffic barrier in Pennsylvania [7]. The study defined various types and severities for damages caused by guardrails to present new checklists for the field surveys [8]. The NCHRP report 656 (2010) pointed out all the possible damages related to guardrails and rated them according to the frequency and severity of the damages observed in each panel. Molan and Ksaibati developed a new model called “Barrier Condition Index (BCI)” considering the findings presented in Roadside Design Guideline (RDG) (2011) and previous studies [9]. Then the new BCI was used to evaluate the condition of the traffic barriers in a range from one to four (one represents a bad condition while four is a traffic barrier with almost no defect).
Despite the efforts made in the literature, many of the current traffic barriers have not been improved from the installation year, and their design is still based solely on the conditions of traffic volume and speed limit dominated 40 or 50 years ago. Traffic barriers were also announced as the third rank (after trees and utility poles) in the list of fatal crashes hitting fixed-objects in 2008 [10].
The literature review also showed that there are unique contributory factors in different crash types and thus different crash types need to be analyzed separately [11-13]. Therefore, in this study traffic barrier crashes were divided into highway and interstate crashes.
The main objective of this paper was to identify the variables impacting the severity of traffic barriers crashes. For this purpose, 10-year crash data from 2007 to 2016 was collected using CARE (Critical Analysis Reporting Environment) package in Wyoming. Wyoming was chosen as the case study because of the considerable rate of high-severity (fatal and incapacitating injury) crashes involving traffic barriers. It is believed that a combination of factors like high-speed limit locations, adverse weather condition, mountainous areas (with sharp horizontal curves and steep longitudinal grades), and a high percentage of truck traffic resulted in the high-severity crashes in Wyoming. For example, as a comparison, the traffic composition of the roads like I-80 or US-30 in Wyoming reaches 50%, while the maximum truck ratio is about 20% in Michigan [14] (Eamon & Siavashi, 2018).
2. METHODS
This study was undertaken to investigate contributory factors of traffic barrier crashes in Wyoming. Due to the low number of fatal and incapacitating injury, these two categories were combined into one group (severe crashes). Also in order to simplify the interpretation, different types of injuries were combined as one category (minor crashes). Thus, the outcome has three categories: severe crashes (Fatal + incapacitating), Minor crashes (possible injury + injury + non-incapacitating injury), and Property Damage Only (PDO) crashes (reference). One of the necessary assumptions of ordered logistic regression is the distance between different categories that should be the same. This assumption is called the proportional odds assumption. For ordinal model, fitted surfaces for the logits are parallel [15]. When this assumption is not fulfilled for ordinal regression model, multinomial logistic regression is suitable, which assumes there is no order of the categories of the outcome variable. The null hypothesis that all the slopes are equal across the different crash severity level will be rejected if the p-value for the test of proportional odds assumption is less than 0.05.
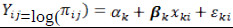
The response variable, denoted Yij for observation i and crash severity j, is used to denote crash severity types. Thus, the response is assumed to have a multinomial distribution. Different predictors such as driver characteristics and environmental characteristics are used as the explanatory variables denoted by xk1, xk2, …, xkp, where i indexes the observation (crashes),k as crash severity level, and p is the number of predictors. Multinomial logistic regression is used to model nominal outcomes with more than two levels [16]. For the j multinomial categories, there are j(j-1)/2 pair of categories and j(j-2)/2 predictors [17]. By using j as a baseline category, j-1 comparisons are considered in relation to the reference category. The baseline category was PDO.
The probability of crash falling in category k for multinomial logistic regression can be written in a linear form as:
 |
(1) |
Where αk is a constant, βk is an estimated coefficient for crash severity level of k and
 is error term. The probability for crash severity for category k, and for crash i can be written as
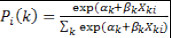 |
(2) |
The logit, log-odds, that observation i falls in response category j relative to the base category J could be written as:
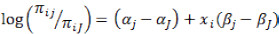 |
(3) |
Odds ratio are commonly used to interpret the effects of the predictors on the response category. The Odds Ratio (OR) is the ratio of the odds obtained from the model probability for one combination of regressors relative to the odds for the model probability of another combination of regressors. This assumes the other predictor variables, not of interest, are constant across the comparison. As in Shinstine et al. (2016) [18], consider a specific binary predictor xk = xki that is not involved in any interaction effect. The odds ratio for xk = 1 compared with xk = 0 for category j with reference category J is
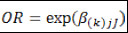 |
(4) |
Now, consider a comparison between two levels of a binary predictor xk that is involved in a single interaction effect with the binary predictor xt. When there is an interaction effect between xk and xt., the impact of the predictors xk and xt on the response cannot be interpreted separately.
For xk = 1, xt = 0 compared to xk = 1, xt = 0, the odds ratio is again given by equation (3). However, when xk = 1, xt = 1 compared with xk = 0, xt = 1 the odds ratio is given by
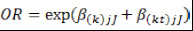 |
(5) |
When xk = 1, xt = 1 compared with xk = 0, xt = 0 the odds ratio is given by
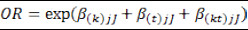 |
(6) |
Furthermore, if xk is involved in another pairwise interaction with a binary predictor, say h, then formulas (3) and (4) still hold, but with xh = 0. Now, equations (3) and (4) are unknown since they depend upon the unknown regression coefficients (βjJ). Estimated odds ratios are calculated by plugging in the estimates of these regression coefficients (
 ) into these equations. The estimated Odds Ratio (OR) will be presented and discussed in the results section.
3. DATA PREPARATION
The data used in this study included barrier data as well as crash and vehicle data for the period of 2007-2016. The data were acquired from the Wyoming Department of Transportation (WYDOT). For the sake of this study, four types of barrier types were incorporated in the dataset including traffic barrier face, traffic barrier end, cable barrier, and concrete traffic barrier. Therefore, crashes were included in the dataset if a vehicle hit any of the above traffic barriers as the first harmful event. Variables used in this study were categorized into six characteristics: driver, crash, temporal, environmental, roadway, and vehicle. Driver characteristics included gender, age, residency, speed limit compliance, driver conditions, and citation record at the time of the crash. Crash characteristics included: point of impact, vehicle maneuver, traffic, and number of vehicles. Temporal characteristics such as the day of a crash, and time of the crash. Different variables were categorized under the environmental category such as weather and road conditions. As different characteristics and driver actions were expected for interstates and highways, the two analyses were conducted for these two roadway systems. Age category of 35 was chosen as this age group divide the crashes into the almost equal category. The categories of significant variables along with incorporated reference categories are presented in Table 1. Table 2 presents the descriptive analysis of the significant variables for different crash severity groups.
| Variable Name | Variable Description | Variable Type | Variable Categories |
|---|---|---|---|
| Severity (response) | Crash severity for barrier involved in crashes | Categorical | PDO Injury/Possible injury Fatality/ incapacitating |
| Road conditions | Indicator of roadway surface condition at the time of a barrier crash | Categorical | Dry (reference) Wet Snow Other (slush, sand) Ice |
| Speed compliance | Indicator of whether an estimated speed of an involved vehicle was within the range of posted speed limit | Categorical | Yes (reference) No |
| Negotiating Horizontal Curve | Indicator that whether a driver was negotiating a curve at the time of barrier crashes | Categorical | No (reference) Yes |
| Driver age | Indicator of the age of drivers involved in a barrier crash | Categorical | <35 years old (reference) >=35 years old |
| Driver gender | Indicator of the gender of a driver involved in barrier crashes | Categorical | Male Female |
| Driver conditions | Indicator of the driver condition at the time of a barrier crash | Categorical | Under normal conditions (Reference) Under non normal conditions |
| Type of impact | Indicator of the location of a vehicle that hit the barrier | Categorical | Other types of impact Other (Reference) Head-on |
| Alcohol citation record | Indicator whether a driver had an alcohol related citation in his record prior to involve in a barrier crash | Categorical | Did not have an alcohol citation (Reference) Had alcohol citation in the record |
| Driver citation record | Indicator whether a driver has any citation prior to being involved in a barrier crash | Categorical | Did not have any citation in his record (reference) Did have a citation in his record |
| Driver improper restraint | Indicator whether a driver restrained properly at the time of barrier crashes or not | Categorical | Restraint was used properly (reference) Restraint was not used properly |
| Variable |
No Injury Frequency (%) |
Non-Incapacitating/Possible Injury Frequency (%) |
Fatal/Incapacitating Frequency (%) |
Total Frequency (%) |
|---|---|---|---|---|
| Highway Roadways | ||||
| Road conditions | ||||
| Dry (reference) | 450 (24) | 240(13) | 74 (4) | 787 (42) |
| Wet | 98 (5) | 37(2) | 7 (0.4) | 147(8) |
| Snow | 202 (11) | 23(1.24) | 4(0.21) | 232(12.46) |
| Slush | 78 (4) | 8(0.4) | 2(0.1) | 91(5) |
| Ice | 506 (27) | 82 (4) | 7 (0.38) | 605 (32) |
| Driver characteristics | ||||
| (age) <35 (reference) | 738 (40) | 208 (11) | 34 (2) | 996 (53.5) |
| (age) >=35 | 595 (32) | 182 (10) | 60 (3) | 864 (46) |
| Driver actions | ||||
| Driver was improperly restrained | ||||
| No (reference) | 738 (40) | 208 (11) | 34 (2) | 996 (55) |
| Yes | 595 (32) | 182 (10) | 60 (3) | 864 (46) |
| Negotiating a curve | ||||
| No (reference) | 738 (40) | 208 (11) | 34 (2) | 996 (54) |
| Yes | 595 (32) | 182 (10) | 60 (3) | 864 (46) |
| Interstate Roadways | ||||
| Type of barrier | ||||
| Concrete | 424 (7) | 147 (3) | 19 (0.3) | 606 (11) |
| Cable | 1451 (25) | 110 (2) | 18 (0.3) | 1594 (28) |
| Road Conditions | ||||
| Dry (reference) | 1164 (20) | 329 (6) | 94 (2) | 1616 (28) |
| Wet | 440 (8) | 98 (2) | 17 (0.3) | 560 (10) |
| Snow | 467 (8) | 52 (0.9) | 4 (0.07) | 526 (9) |
| Slush | 220 (4) | 28(0.5) | 2(0.03) | 256(4) |
| Ice | 2437(42) | 322(6) | 29(0.5) | 2802(49) |
| Driver characteristics | ||||
| Driver age | ||||
| <35 (reference) | 2598(45) | 438 (8) | 57 (1) | 3111(54) |
| >=35 | 2130(37) | 390(7) | 89 (1.55) | 2643(46) |
| Driver gender | ||||
| Female | 1457(25) | 346(6) | 42(0.7) | 1858 (32) |
| Male (reference) | 3268 (57) | 482(8) | 104 (2) | 3873 (67) |
| Driver condition | ||||
| Normal (reference) | 3757(65) | 551(10) | 58(1) | 4378(76) |
| Non normal | 898(16) | 265(5) | 85(2) | 1285(22) |
| First harmful event | ||||
| Front head collision | 2211(38) | 428(7) | 56(1) | 2719(47) |
| Roll over | 39 (1) | 37(1) | 14(0.2) | 91(2) |
| Negotiating a curve | ||||
| Yes | 565(10) | 134(2) | 26(0.5) | 729(13) |
| No | 4163(72) | 692(12) | 120(2) | 2031(87) |
| Driver Action | ||||
| Restrain: Driver was improperly restrained | ||||
| No | 4378(76) | 642(11) | 93(2) | 5167(90) |
| Yes | 350(6) | 187(3) | 53(1) | 593(10) |
| Alcohol citation record | ||||
| No | 2500(43) | 350(6) | 64(1) | 2959(51) |
| Yes | 2228(39) | 479(8) | 82(1) | 2801(49) |
| Driver had improper driving action | ||||
| No | 1315(23) | 201(3) | 45(1) | 1586(28) |
| Yes | 3413(59) | 628(11) | 101(2) | 4174(72) |
| Speed limit was complied | ||||
| Yes | 4335(75) | 732(13) | 114(2) | 5224(91) |
| No | 219(5) | 71(1) | 25(0.4) | 392(9) |
4. RESULTS
The literature review indicated that there are unique contributory factors to various crash types and thus each crash types need to be analyzed separately. Therefore, in order to identify the unique contributory factors to barrier crashes, this study only incorporates crashes impacting traffic barrier. Crashes were divided into two parts: non-interstate and interstate highway systems due to the operational differences in these two road classifications.
4.1. Non-Interstate Highways
In order to investigate the suitability of multinomial logistic regression, proportional odds assumption was checked before running any analysis. The results of the test showed the p-value of 0.03 which is an indication of no order to the crash severity categories, making this analysis suitable for the identification of contributory factors for the traffic barrier involved crashes on highways in Wyoming. Although about 160 variables were included in the preliminary analysis, only 4 predictors were found to be statistically significant in impacting the odds of severe non-interstate traffic barrier crashes.
In order to account for the possible interactions, the interactions that seemed to be meaningful were investigated. Table 3 shows the results of the multinomial analyses being conducted on non-interstate highways in Wyoming.
The results of roadway conditions indicated that driving in adverse roadway conditions including wet, snow, slush, and ice decreased the odds severe crashes compared with no injury crashes about 4, 7, 9 and 16 times, respectively. On the other hand, not-dry-road surface conditions such as snow, slush and icy decreased the odds of minor crashes 5.2, 5.3 and 3 times, respectively. The lower odds of severe crashes might result from the fact that drivers drive more cautiously on not-dry-road conditions [19].
Age was another factor which impact the severity of barrier involved crashes. The results indicated that older drivers are more likely to be involved in more severe/minor barrier involved crashes: older drivers are more than three times more likely to be involved in severe crashes. This impact might be likely to form the age-related vulnerability while hitting barriers.
Improperly, restrained driver at the time of crashes was identified as a factor that increased the odds of serious injury and minor crash about 3 (OR= 2.7) and 4 times (OR=4.24), respectively. This result is intuitive and numerous studies were conducted about the importance of proper restraint in the reduction of severe crashes [20, 21].
Negotiating a curve was found as a factor that increased the odds of serious crashes more than three times (OR=3.39). This impact is expected since traffic barriers are occasionally installed at the locations with critical horizontal curves.
| Variables | Fatality/Incapacitating Injury | Non Incapacitating/Possible Injury | |||||
|---|---|---|---|---|---|---|---|
| Coefficient | Odds Ratio | P-value | Coefficient | Odds Ratio | P-value | ||
| Intercept | -3.2432 | <.0001 | -0.9228 | <.0001 | |||
| Road condition (Reference: dry road conditions) | Wet | -1.3633 | 0.256 | 0.0291 | -0.3174 | 0.728 | 0.2347 |
| Snow | -1.9766 | 0.139 | 0.0013 | -1.6525 | 0.192 | <.0001 | |
| Slush | -2.2373 | 0.107 | 0.0299 | -1.6814 | 0.186 | 0.0005 | |
| Ice | -2.7976 | 0.061 | <.0001 | -1.1476 | 0.317 | <.0001 | |
| Driver characteristics | Age | 1.1848 | 3.270 | 0.0004 | 0.0782 | 1.081 | 0.6248 |
| Driver Actions | Driver was improperly restrained:yes (reference=no) | 1.4441 | 4.238 | 0.0002 | 0.9914 | 2.695 | <.0001 |
| Negotiating a curve (Reference: others) | 1.2204 | 3.388 | <.0001 | 0.2434 | 1.276 | 0.1505 | |
| Variables | Serious Crashes | Minor Crashes | |||||
|---|---|---|---|---|---|---|---|
| Coefficient | Odds Ratio | P-value | Coefficient | Odds Ratio | P-value | ||
| Intercept | -4.3555 | <.0001 | -1.5981 | <.0001 | |||
| Type of barrier (Reference: others) | Concrete | 0.0574 | 1.059 | 0.8610 | 0.4269 | 1.533 | 0.0007 |
| Cable | -1.4343 | 0.238 | <.0001 | -1.0637 | 0.345 | <.0001 | |
| Road condition (Reference: dry) | Wet | 0.0985 | 1.103 | 0.7797 | 0.0595 | 1.061 | 0.7117 |
| Snow | -1.4675 | 0.230 | 0.0188 | -0.7104 | 0.491 | 0.0002 | |
| Slush | -1.5894 | 0.204 | 0.1239 | -0.6452 | 0.525 | 0.0152 | |
| Ice | -1.1137 | 0.328 | 0.0006 | -0.5042 | 0.604 | <.0001 | |
| Driver characteristics | Age: <35 (Reference:>=35) | 0.8716 | 2.391 | 0.0002 | 0.0949 | 1.100 | 0.3041 |
| Gender: Male (Reference:female) | -0.3552 | 0.701 | 0.1436 | -0.6421 | 0.526 | <.0001 | |
| Drive action | Driver condition: non normal (Reference: normal) | 1.4458 | 4.245 | <.0001 | 0.6403 | 1.897 | <.0001 |
| Front head collision | -0.0259 | 0.974 | 0.9126 | 0.2869 | 1.332 | 0.0022 | |
| Negotiating a curve (Reference: others) | 0.5627 | 1.755 | 0.0374 | 0.2079 | 1.231 | 0.1029 | |
| Roll over | 2.5057 | 12.252 | <.0001 | 1.8960 | 6.659 | <.0001 | |
| Driver was improperly restrained:yes (reference=no) | 1.6077 | 4.991 | <.0001 | 1.0005 | 2.720 | <.0001 | |
| Driver alcohol citation record: yes (reference: no) | 0.3124 | 1.367 | 0.4056 | 0.6363 | 1.889 | 0.0033 | |
| Driver had an improper driver action:yes (reference: no) | 1.6077 | 1.453 | <.0001 | 1.0005 | 1.300 | <.0001 | |
| Speed limit was not complied (Reference: speed limit was compiled) | 0.8734 | 2.395 | 0.0040 | -0.1024 | 0.903 | 0.5632 | |
4.2. Interstates Highways
In this study, interstate highways were separated due to possible differences between the two roadway systems. The proportional odds assumption was checked before running any statistical modeling. The results of this test indicated that there is no ordering between different crash severities, and thus multinomial logistic regression is suitable.
As shown in Table 4, the results indicated that types of barrier were important predictors. Concrete type of barrier increased the odds of minor crash category more than 50 percent (OR=1.53). However, cable barrier decreased the odds of minor crashes and major injury severity about 3 and 4 times. The results of the difference between these two barrier types are intuitive and could be related to the rigidity of each traffic barrier.
Although the impacts of adverse road condition on interstate traffic barrier involved in crash severity were similar to highway crashes (decreasing), the degrees of impact was different. Snowy, slushy, and icy road way conditions decrease the odds of minor crashes more than 200% (1/0.491), 90% and 65%, respectively. On the other hand, the odds of serious crashes decreased on snowy and icy road way conditions by 4 and 3, respectively.
Similar to non-interstate highway systems, older age group increased the odds of serious injury crashes. The impact could be related to a decrease in physical and mental capabilities of the elderly [22]. Female drivers are more likely to be involved in minor injury compared to male drivers, who hit barriers. The reason is explained by the study conducted by Molan, Rezapor, & Ksaibati (2019) as female drivers are not more likely to be involved in crashes, however, when they are involved, they are more likely to be injured [21].
Non-normal driver conditions factor was found to be significant with a positive sign for both minor and serious injury crashes. When drivers were driving under nonnormal conditions the odds of being involved in minor and serious crashes increased by estimated odds of 1.897 and 4.245. The results confirmed the results of the previous study that driving under not normal mental conditions may increase the odds of severe crashes [21].
Rollover crashes were not excluded from the data as traffic barrier had an impact on the severity of this type of crashes [3]. The results of this factor indicated that when rollover occurred in traffic barrier crash, the odds of minor and major crashes increased by an estimation of more than 6 and 12 times, respectively. The high impact of rollover in crashes has been investigated in the previous studies [13, 21].
Having an alcohol-related citation in drivers’ record was found to increase the odds of minor crashes by about 89%. The importance of citation in predicting future crashes was investigated in the literature review [23].
Previous studies conducted in Wyoming indicated that more than 50% of all the crashes in Wyoming resulted from drivers having no improper driver action at the time of crashes [21]. However, the results of this study indicated that when drivers showed improper action at the time of crashes, the odds of both categories of crash severity increases.
Speed limit compliance was another important predictor for crash severities. While no impact was found for this predictor on minor crashes, the results indicated that the odds of serious crashes increased by an estimation of more than two times (OR=2.395).
CONCLUSION
There are many benefits associated with traffic barriers including preventing vehicles from running into hazards on the sides of the roads, keeping vehicles from sliding off sharp turns, and keeping the vehicles on the roads. Although barriers prevent much of the run of the road fatalities, severe crashes resulting from hitting barrier can be prevented/reduced by identification of contributory factors to severe crashes, and consequently taking appropriate countermeasures. The literature review indicated the unique contributory factors of each crash types, and thus each crash type needs to be analyzed separately. Therefore, this study was set forward by including only the barrier crashes to identify the contributory factors to serious and minor crashes compared to PDO crashes. Also, interstate and highway barrier crashes were investigated separately.
Before conducting a multinomial logistic regression model, appropriateness of this model type should be evaluated by proportional odds assumption tests. The results of the tests for non-interstate and interstates highways showed p-values less than 0.05, indicating that multinomial logistic regression is appropriate for investigating contributory factors at different levels of crash severity.
Road surface conditions, negotiating a curve, and improper restraint in use were the factors that impact both types of highway systems. The results indicated that driving on highways with icy conditions had the highest reduction on serious crashes, more than 16 times. This impact highlighted the importance of being cautious while driving. On the other hand, improper restraint has the highest contributory factor on serious and minor injury crashes, compared to PDO.
The results of interstate crash analysis indicated that while concrete barriers increased the odds of minor injury crashes, cable barrier decreased the odds of both minor and serious crashes. This resulted from the designs of these two barriers, which is related to the degree of flexibility of these two traffic barriers.
The results of alcohol citation record and having improper driving actions indicated that drivers with past citations record or with improper driving actions are at higher risk of being involved in serious barrier crashes. The highest contributory factor was related to rollover type of driver action. The results indicated that traffic barrier crash severity is not only a matter how well barriers are designed but are also related to the driver's performance, experience, and behavior.
Although the above results could provide some helpful implications about different contributory factors to barrier crashes, the practical decision about the use of barrier should be made by considering other important factors such as barrier maintenance and geometric characteristics. For instance, locations, where traffic barrier is expected to be struck by vehicles or vehicles are expected to stop to prevent more crashes, e.g. median barrier, concrete barrier is recommended instead of cable, as the cable is flexible and would not stop the vehicle right away at the time of crashes. The results of this study could be beneficial especially for the mountainous states, and with similar weather conditions, like Wyoming. Although the results of this study could provide a better understanding about factors contributing to traffic barrier crashes, for the future study it is recommended to consider and include different traffic barrier/roadside characteristics such as shoulder width and height of traffic barriers.
AVAILABILITY OF DATA AND MATERIALS
Not applicable.
FUNDING
The authors would like to acknowledge that this work is part of project #RS03218 funded by the Wyoming Department of Transportation (WYDOT). The subject matter, all figures, tables, and equations not previously copyrighted by outside sources are copyrighted by WYDOT, State of Wyoming and the University of Wyoming. All rights reserved copy righted in 2016.
CONSENT FOR PUBLICATION
Not Applicable
CONFLICT OF INTEREST
On behalf of all authors, the corresponding author states that there is no conflict of interest.
ACKNOWLEDGEMENTS
Declared none.

