All published articles of this journal are available on ScienceDirect.
Effect of Driver Response on Efficiency of Vehicular Communication using Penalty Cost Function (EVCPCF)
Abstract
Background and Objective:
This study examines and takes into account three key timing factors that have an impact on the effectiveness of human-machine interfaces (HVI). A threshold-based mechanism is created to account for both cooperative driving and advanced vehicle control system (AVCS) scenarios. For AVCS and cooperative driving, the developed model takes into account on-board machine interface time, human interface time, and transmission time.
Methods:
A threshold function that represents the penalty cost of a slow driver reaction is presented in order to enable adaptive intelligence, enhance HVI design, and increase vehicle safety. The Penalty Cost Function (PCF) is used to make vehicle control systems intervene and take control in situations where the driver responds slowly to safety and warning messages. Additionally, this study demonstrates that AVCS-based vehicular systems are more responsive overall and are less impacted by the PCF function than cooperative systems.
Results:
The mathematical models created through this work allowed for a limiting efficiency value and capping for each driving scenario, according to comparative plots. This will improve the creation of more reliable control systems as part of a vehicle's mechatronics, impacting how vehicles communicate with one another in a cooperative setting. MATLAB simulation was used to verify the mathematical model. The simulation covered two limiting cases of 0.33 and 0.5 and used incrementing numbers of vehicles (10, 20, 30, 40, 50) to check the impact of increasing vehicle numbers on communication efficiency and examine whether both AVCS and AVCS with cooperative will have close levels and converge at limiting values.
Conclusion:
The successfully completed simulation demonstrated that throughput decreased as the number of vehicles increased, although in the limiting case, both scenarios and the driving system changed virtually by the same percentage.
1. INTRODUCTION
Recent advances in vehicle research have greatly advanced the fields of connected and autonomous driving. Advance Vehicle Control System (AVCS)-based Advanced Driving Assistant Systems (ADAS) have been created and have transitioned from providing information and warnings to fully autonomous driving [1-5]. Intelligent Transportation Systems' objective for vehicular communication is to improve road efficiency and safety. Through cooperative driving, the driver's actions and response to messages received can also improve mobility and comfort.
Under cooperative driving, the driver's response time, which is strongly related to the Human-Vehicle Interface (HVI), also known as the Human-Machine Interface (HMI), is proven to be crucial in terms of preventing accidents [6-9]. The HVI interface design considers not only how the driver responds in terms of time and action but also how the driver's decision affects the driving experience.
Simulation and analysis of the driver's response time to received messages are needed in order to streamline the modeling of the interaction between the driver and vehicle interface, enabling better interface design and optimizing the vehicle control system. It has been noted that the design, control, and processing of exchanged signals sent to drivers or vehicle control systems for decision-making are affected by the mathematical model and simulation [10-13].
Numerous scholars have investigated and conducted a study on drivers' thought patterns, reactions, emotions, and subsequent decision-making [14-18]. The studies examined how the procedure through which the driver receives a message, the timing, and the cognitive and psychological condition of the driver at the moment of getting a warning or alert through the interface influenced the actions made by the driver [19-21].
Intelligent vehicles, which are the future of the automotive industry, have recently been more widely available. These vehicles offer a number of advantages, such as less infrastructure development, improved safety and mobility, less traffic congestion, better fuel economy, and lower transportation costs, while driving in more comfort. These benefits can only be realized if an optimized level of interaction between the driver and the vehicle is achieved through adaptive design and simulation [22, 23].
Driver role is still crucial in autonomous vehicles with varying levels of automation, primarily in levels 1, 2, and partially level 3. This is significant because the driver must be aware of the handover process and be able to resume manual driving in occasionally dire circumstances [24-26].
The primary issues in autonomous and collaborative driving are:
1. A safe transition in which the driver quickly assumes control.
2. The impact of driver response time on the overall process of mobility and safety.
Therefore, it is necessary for vehicle interface design to take all factors impacting cooperative and autonomous driving into account, with an emphasis on the transition between autonomous and manual driving and the driver response time as a common factor.
To provide the best possible interface between drivers and their vehicles, considerations for HVI designs are made. The standard HMI has the ability to send messages resulting from cooperative driving via vehicle connectivity as well as information generated by vehicle sensors and processing systems. Additionally, adopting AVCS offers driver support through a sensor-actuator process by monitoring the surrounding and driving environment, which contributes to safer and more mobile driving by preventing collisions with other vehicles and pedestrians, among other services [27-30].
The interaction between the driver and the vehicle in cooperative and autonomous driving environments (automated and connected vehicles) depends on the interface that is designed for information processing and delivery from the system to the driver as well as actions taken by the driver as a result of receiving messages, including confirmation of suggested actions by the vehicular system. The driver's mental state, the given interface design, the road condition, and the environment all have an impact on the driver's condition and state, which, in turn, influences the driver's response time.
In support of situation perception technology and quick-response driving behavior, using connected and autonomous vehicles would boost traffic safety levels [3]. However, connected and autonomous cars (CAVs) and HVI are incompatible with one another due to variations in driving behavior and decision-making, particularly when the vehicle needs the driver's agreement for a message that is presented on the HMI. According to research, integrating CAVs could increase stability and boost traffic safety by preventing a cascade of brake incidents due to their beyond-line-of-sight capabilities. By maintaining an appropriate range for the time to collision in the mixed traffic flow, a rise in the penetration rate of CAVs would considerably improve traffic safety [31].
The conflict impacts of CAVs and HVI will be lessened as CAV utilization increases. By reducing conflicts, the employed control algorithm significantly improves road safety even at modest penetration rates of CAVs. The average number of collisions would be greatly decreased if all vehicles were equipped with connected or autonomous vehicle technologies [32].
Shifting towards the application of Connected and Autonomous Vehicles (CAVs) has been expedited by recent technological advancements. By replacing human drivers, CAVs have the potential to greatly boost road safety. However, it has been very challenging to assess the effects on safety because of the absence of genuine CAV data from the real world. Studies that attempt to simulate CAVs by using a single simulation or combining several simulation platforms have limitations and often only consider a limited section of the structure of the road network [33].
In this work, innovative designs for autonomous and cooperative driving environments are described, along with modeling of the interaction between the driver and the offered vehicular interface and its impact on the actions performed by the vehicular control system. In order to enable automated and networked vehicular contact, driver response time, message, communication, and processing times are considered the parameters for autonomous and cooperative driving. The objective of this work is to facilitate improved and more optimized driver-vehicle interactions by taking into account how human response affects decision-making and by presenting an intelligent model to mitigate human error. This is made possible by correlating the human component with the sensors, electronics, and communication systems utilized in vehicles. In order to evaluate the proposed mathematical model, this study presents the impact of the efficiency function on data traffic and throughput through MATLAB simulation.
The rest of this paper is divided as follows: method, results and discussion, conclusion, and references.
2. METHODOLOGY
A significant shift and change will occur in mobility and related transportation systems. Traditionally, drivers of vehicles have been humans, but as new automation capabilities become available, this is starting to change. According to predictions, this shift will significantly reduce accidents, save lives, and boost the economy for society as a whole. The hypothesis is that transportation technologies will become advanced, become stable, and mature enough to be employed safely. The primary argument for why autonomous vehicles will make roads safer is that they would reduce the likelihood of human error [34].
Driver actions are largely determined by how they respond to messages transmitted through HVI. However, the processing time of the hardware (sensors and electronics) and the communication time in the case of connected vehicles (cooperative driving) are both closely related to the driver response time.
This research is based on the concept that modeling the driver's response time, along with the impact of processing and communication times under various scenarios, can significantly improve the design and communication protocols for connected and autonomous vehicles.
The adoption of a modified threshold function is justified by the requirement for a maximum value limiting function in the proposed efficiency control framework in order to support comparative decision-making. As a result of this, the mathematical model will gain intelligence. Additionally, the methodology in this paper takes into account the impact of failure utilizing a probability function.
The primary factors taken into account in the considered mathematical model are:
1. Response time (Thuman interface): The amount of time needed between the time a message is delivered to and made obvious to the driver and the moment the driver recognizes that an action has to be taken. The length of the driver interaction depends on the driver's mental state, age, experience, physical condition, weather, and HVI design.
2. Processing time for the vehicle's sensors and hardware (Tmachine interface), or the amount of time needed to process a message received by the on-board unit inside a vehicle (OBU).
3. Transmission time (Ttransmission): The time taken for a message to be received by the vehicle OBU if the vehicle is connected.
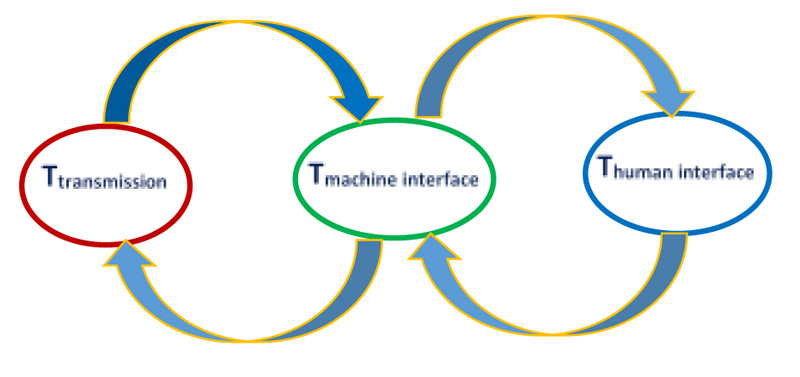
On the basis of the presumptions made previously, a mathematical model can be created. Such a model will demonstrate the role played by each factor taken into account in the efficient control of the vehicle. Many accidents can be avoided if a reliable, vehicular management system is used to overcome human driver limitations (Fig. 1). Table 1 defines the used symbols.
|
Symbols/ Acronyms |
Meaning | |
|---|---|---|
| Tmachine interface | Transmitted message processing time. | |
| Thuman interface | Required time for the driver to take action. | |
| Tthreshold | A limiting time value above which the vehicular automated control system will take action. | |
| 0 | The penalty cost function, which enables automatic control based on time variables. | |
| Efficiency | Effectiveness of message processing in relation to human response. | |
| ψ | The ratio of Machine interface time to human interface time. | |
| Ttransmission | Elapsed time for a sent message to be received. | |
| ϕ | The ratio of transmission time to human interface time. | |
3. HVI MATHEMATICAL MODEL
3.1. ADAS and AVCS-Supported Vehicular Driving
Equation (1) can be used to calculate the impact of the driver response time on the effective actions taken when messages are received by the driver through the HVI interface. There will be a driver-limiting threshold value for the function, and if it is surpassed, the vehicle control system will intervene to ensure safety.
 |
(1) |
Where:  is a penalty cost function used to activate automatic control by the vehicular system.
From equation (1), the following conditions can be applied:
1. Thuman interface = Tthreshold: In this case, equation (1) becomes equation (2).
 |
(2) |
Equation (2) can be re-written as equation (3). This will enable the simulation of the human interface and driver response effect.
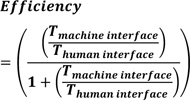 |
(3) |
Equation (3) can be re-written as equation (4).
 |
(4) |
ψ always less than 1 as Thuman interface > Tmachine interface ψ = 1 sets a limiting value of 0.5 at which there are two scenarios:
a. The vehicle is in autonomous mode control T_(human interface) ≠ T_(machine interface).If the vehicle is not in autonomous mode, then the vehicular system fails, and there is a major technical issue. This is confirmed when ψ continues to increase, indicating a failure in the electronic vehicular system.
2. T_(human interface)>T_threshold In this case, equation (1) becomes equation (5).
 |
(5) |
Equation (5) can be simplified as equation (6).
 |
(6) |
Equation (6) reduces to equation (7).
 |
(7) |
As human interface time approaches the threshold level θ => 1, thus equation (7) is reduced to equation (4), with a limiting value of 0.5.
3. T_(human interface)<T_threshold: In this case, equation (1) becomes equation (8).
 |
(8) |
Equation (8) can be re-written as equation (9).
 |
(9) |
Equation (9) results in equation (10).
 |
(10) |
As human interface time approaches the threshold level, θ => 1 thus equation (10) is reduced to equation (4), with a limiting value of 0.5.
3.2. ADAS and AVCS with Cooperative Driving Support
In this case of cooperative driving, an additional time element covering transmission time is considered. Thus, equation (1) becomes equation (11).
 |
(11) |
From equation (11), the following conditions can be applied:
a. T_(human interface) = T_threshold:In this case, equation (11) becomes equation (12).
 |
(12) |
Equation (12) can be re-written as equation (13).
 |
(13) |
Equation (13) can be re-written as equation (14).
 |
(14) |
It is safe to assume that ϕ = ψ hence equation (14) is reduced to equation (15).
 |
(15) |
b. T_(human interface) > T_threshold: In this case, equation (11) becomes equation (16).
 |
(16) |
Equation (16) can be re-written as equation (17).
 |
(17) |
Equation (17) results in equation (18).
 |
(18) |
It is assumed previously thatϕ = ψ,thus equation (18) reduces to equation (19).
 |
(19) |
As human interface time approaches the threshold level, 0 => 1thus equation (19) is reduced to equation (15), with a limiting value of 0.33.
c. T_(human interface) < T_threshold: In this case, equation (11) becomes equation (20).
 |
(20) |
Equation (20) can be re-written as equation (21).
 |
(21) |
Equation (21) is reduced to equation (22).
 |
(22) |
As human interface time approaches the threshold level0 => 1,thus equation (22) is reduced to equation (15), with a limiting value of 0.33.
4. RESULTS AND DISCUSSION
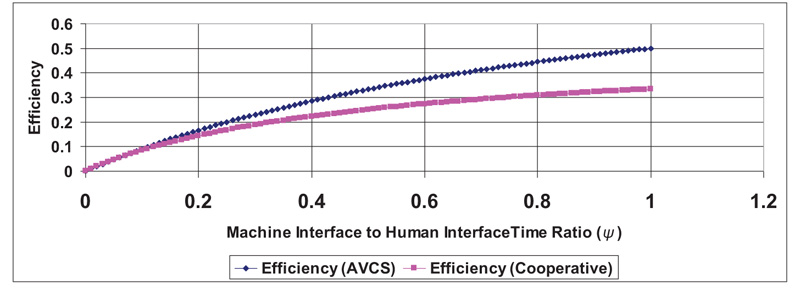
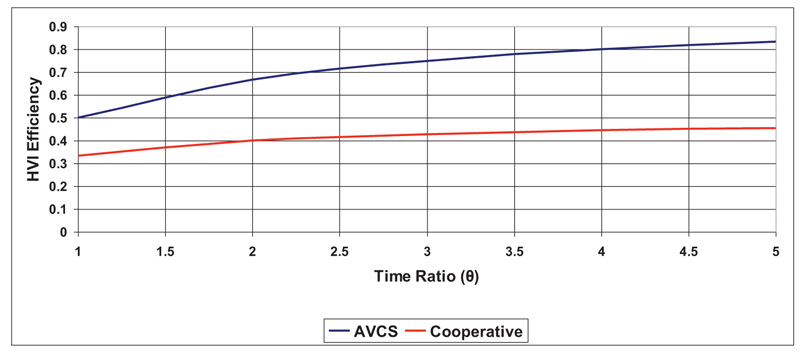
Fig. (2) shows a relationship between HVI efficiency and the change of machine interface time to human interface time for both AVCS-based vehicular driving and cooperative vehicular driving for the condition of Thuman interface = Tthreshold. The figure shows two main points:
1. As human interface time becomes shorter (more responsive and alert driver), HVI efficiency increases.
2. The efficiency in the AVCS case is higher than in the cooperative case for the same driver or similar driver behavior.
The mathematical model representing the general response of HVI efficiency as a function of machine interface to human interface time ratio for the condition of Zero penalty cost function (Thuman interface = Tthreshold) can be represented by equation (23):
 |
(23) |
Where: α ≥ 0.3, 0.6 < β <0.9, 0.01 < γ <0.03
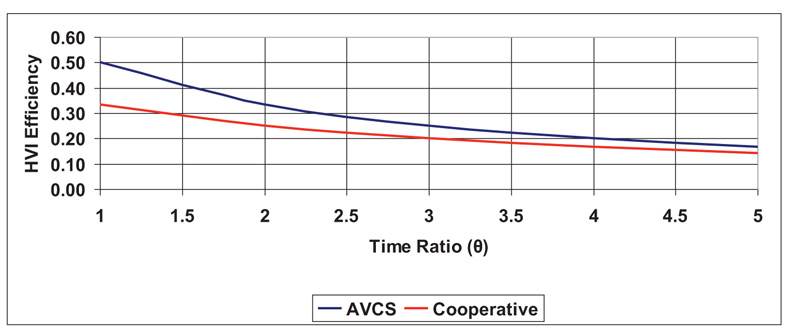
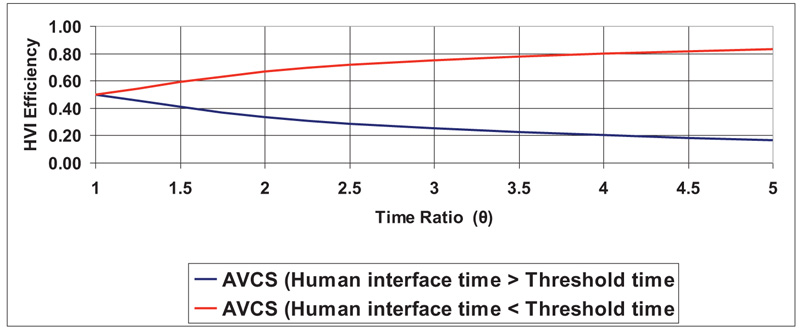
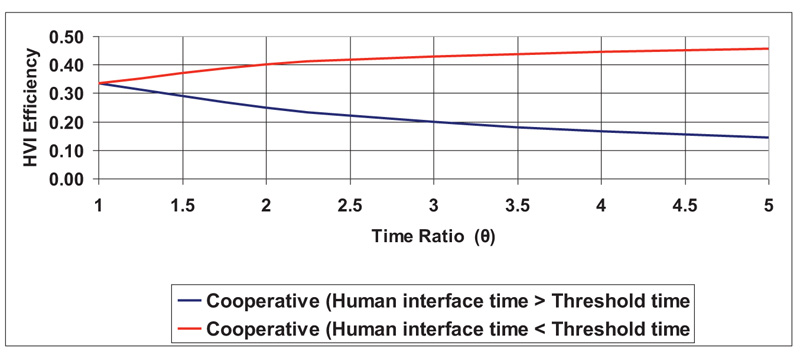
Fig. (3) shows the case where Thuman interface> Tthreshold, representing the effect of the penalty cost function (PCF) on both AVCS-based vehicular driving and cooperative driving. As shown, the efficiency decreases significantly at high values of θ, but with AVCS, efficiency is still higher than cooperative at low θ values. However, both AVCS and cooperative converge to a common value at high θ.
From Fig. (3), equation (24) describes the dynamics between efficiency and θ for both AVCS and cooperative-based HVI.
 |
(24) |
Where: 0.3 < α < 0.6,0.5 < γ < 0.7
Comparing Figs. (2 to 1), the dynamical change is evident in both AVCS and cooperative-based HVI behavior, which is due to PCF.
Fig. (4) shows the effect of inverse PCF (reward function), which is due to the dramatic reduction in the PCF (Thuman interface < Tthreshold).This resulted in a total dynamical change in the HVI response as the driver’s interaction with received messages and subsequent actions taken by the vehicular control system are carried out within the specified threshold range.
Equation (25) describes the dynamics relation of HVI efficiency to θ.
 |
(25) |
Where: 0.3 < α < 0.6, 0.2 < γ < 0.4
The lower values for equations (23-25) relate to cooperative, and the upper values relate to AVCS.
The link between efficiency and the same HVI vehicular system for high PCF and low PCF is shown in Figs. (5 and 6). The figures depict upper values for both the AVCS and the cooperative that are capped or limited at 0.5 and 0.33, respectively, with both PCF conditions emanating from and diverging from these values.
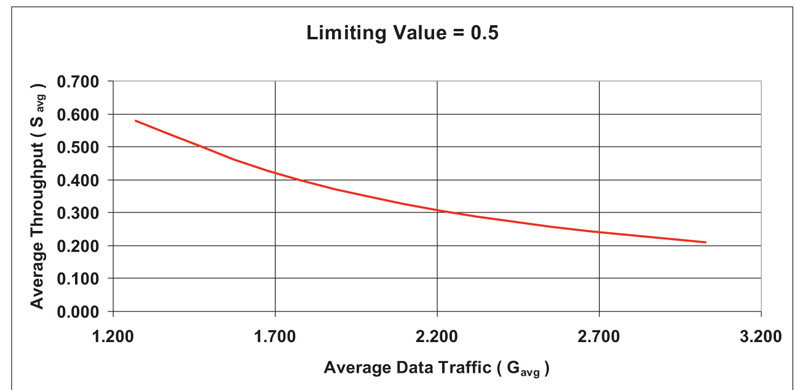
A MATLAB simulation is run using an increasing number of vehicles (10, 20, 30, 40, 50), a frame length of 10, and a communication waiting time of 15 slots in order to validate the provided mathematical model. The simulation examined the limiting situation of equations (4) and (19), testing data traffic and throughput with efficiency values of 0.5 and 0.33, demonstrating that with high values, both AVCS and cooperative systems will converge to similar values at the limiting values.
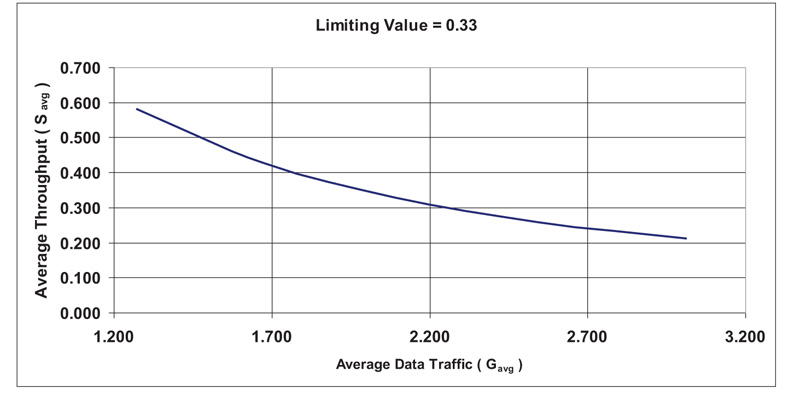
The relationship between data traffic and throughput for the limiting case of 0 => 1 under ADAS and AVCS Supported Vehicular Driving and as a function of increasing the number of communicating cars is shown in Fig. (7) and equation (26), respectively. According to the results, throughput will decrease as a result of a higher volume of data traffic and limitations on bandwidth, reaction times, and communication and processing times, as well as increased vehicle density. The data will also experience collisions.
 |
(26) |
Where: Ω < 0.8, Ν < 1.2
The relationship between data traffic and throughput for the limiting case of 0 => 1 under ADAS and AVCS with Cooperative Driving Support and as a function of increasing the number of communicating vehicles is depicted in Fig. (8) and equation (27), respectively. The findings are comparable to the prior example, and both efficiency equations will converge. The curve forms and both equations (26) and (27) show that:
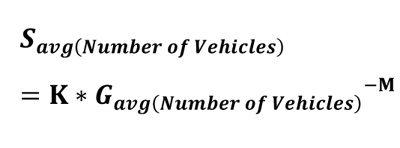 |
(27) |
Where: Κ < 0.8, Μ < 1.2
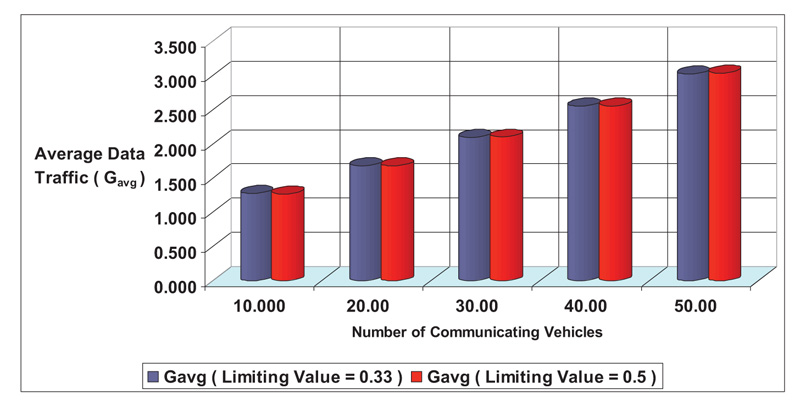
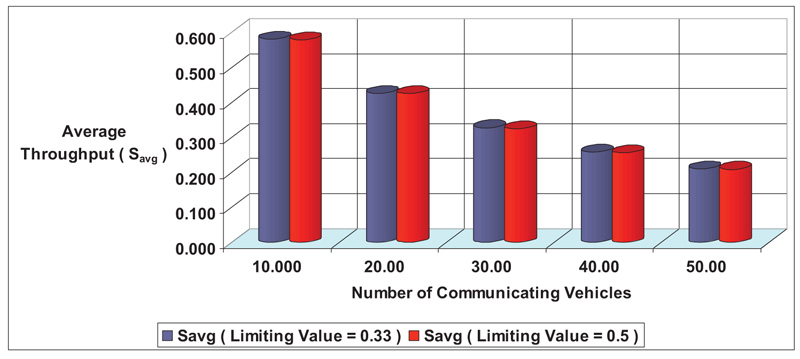
As the number of vehicles increases, Figs. (9 and 10) compare the average data traffic values for the two limiting situations of 0.33 and 0.5. According to these results acquired by MATLAB simulation, both AVCS and AVCS with cooperative driving have close efficiency levels under limiting values, which will be reflected through data traffic and throughput.
CONCLUSION
This paper examined mathematical modeling and simulation encompassing two HVI conditions: cooperative-based and AVCS-based HVI. The established efficiency function has been shown to be a key instrument in characterizing HVI efficiency and the effective interaction between the driver and the vehicle. Such connection has an impact on the dependability and safety of connected and autonomous cars. When comparing the effectiveness of interaction, the AVCS base outperformed the cooperative one. The newly developed PCF has proven successful in triggering an internal alarm to take over driving from the driver and switch to an autonomous mode in order to prevent pointless delays that can result in accidents.
The presented model should be improved and expanded, and a closed-loop feedback control system model based on intelligent algorithms connected to the driver's mental state and the vehicle's design should be created. HVI interface should be considered during the design phase. The MATLAB simulation used to validate the proposed mathematical model revealed the following results:
1. Throughput drops as the number of connecting cars increases, which lowers efficiency.
2. As the efficiency function reaches its limiting values, AVCS and AVCS with cooperative driving converge. Although this may not be ideal, it does bring stability and assurance.
LIST OF ABBREVIATIONS
| HVI | = Human-Machine Interfaces |
| AVCS | = Advanced Vehicle Control System |
| PCF | = Penalty Cost Function |
CONSENT FOR PUBLICATION
Not applicable.
AVAILABILITY OF DATA AND MATERIALS
The authors confirm that the data supporting the findings of this research are available within the article.
FUNDING
None.
CONFLICT OF INTEREST
The author declares no conflicts of interest, financial or otherwise.
ACKNOWLEDGEMENTS
Declared none.


